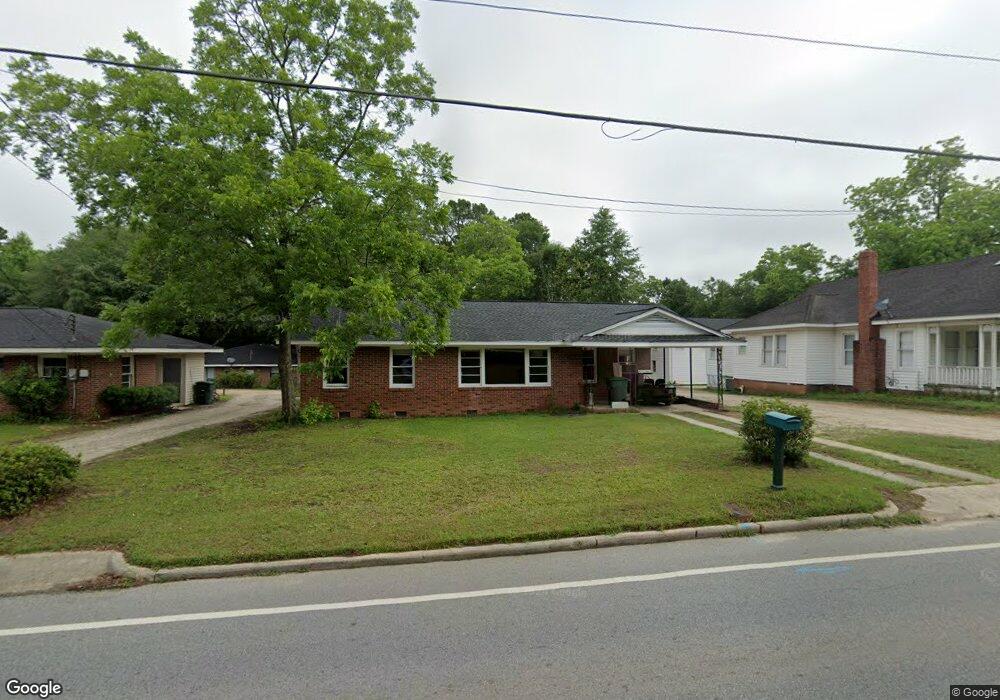
339 E Main St Statesboro, GA 30458
Estimated Value: $263,000 - $309,000
3
Beds
2
Baths
1,843
Sq Ft
$151/Sq Ft
Est. Value
About This Home
This home is located at 339 E Main St, Statesboro, GA 30458 and is currently estimated at $277,700, approximately $150 per square foot. 339 E Main St is a home located in Bulloch County with nearby schools including Statesboro High School, Mill Creek Elementary School, and Langston Chapel Middle School.
Ownership History
Date
Name
Owned For
Owner Type
Purchase Details
Closed on
Jul 23, 2020
Sold by
Chandler Charles Clayton
Bought by
Harville Donna S
Current Estimated Value
Home Financials for this Owner
Home Financials are based on the most recent Mortgage that was taken out on this home.
Original Mortgage
$126,400
Interest Rate
3.1%
Mortgage Type
Commercial
Purchase Details
Closed on
Oct 15, 2015
Sold by
Triple C Properties Llc
Bought by
Chandler Charles Clayton
Home Financials for this Owner
Home Financials are based on the most recent Mortgage that was taken out on this home.
Original Mortgage
$205,250
Interest Rate
3.93%
Mortgage Type
New Conventional
Purchase Details
Closed on
Jun 9, 2004
Bought by
Triple C Properties Llc
Purchase Details
Closed on
Jan 1, 2000
Bought by
Stephens Eddie and Stephens
Create a Home Valuation Report for This Property
The Home Valuation Report is an in-depth analysis detailing your home's value as well as a comparison with similar homes in the area
Purchase History
| Date | Buyer | Sale Price | Title Company |
|---|---|---|---|
| Harville Donna S | $158,000 | -- | |
| Chandler Charles Clayton | -- | -- | |
| Triple C Properties Llc | -- | -- | |
| Stephens Eddie | -- | -- |
Source: Public Records
Mortgage History
| Date | Status | Borrower | Loan Amount |
|---|---|---|---|
| Closed | Harville Donna S | $126,400 | |
| Previous Owner | Chandler Charles Clayton | $205,250 |
Source: Public Records
Tax History
| Year | Tax Paid | Tax Assessment Tax Assessment Total Assessment is a certain percentage of the fair market value that is determined by local assessors to be the total taxable value of land and additions on the property. | Land | Improvement |
|---|---|---|---|---|
| 2025 | $2,859 | $123,800 | $19,240 | $104,560 |
| 2024 | $2,859 | $104,320 | $17,480 | $86,840 |
| 2023 | $2,667 | $93,120 | $17,480 | $75,640 |
| 2022 | $1,616 | $82,396 | $17,502 | $64,894 |
| 2021 | $1,275 | $72,688 | $17,502 | $55,186 |
| 2020 | $1,467 | $70,697 | $17,502 | $53,195 |
| 2019 | $1,465 | $70,175 | $17,502 | $52,673 |
| 2018 | $1,468 | $67,434 | $17,502 | $49,932 |
| 2017 | $1,441 | $65,445 | $17,502 | $47,943 |
| 2016 | $1,441 | $63,785 | $17,502 | $46,282 |
| 2015 | $1,408 | $62,822 | $17,502 | $45,320 |
| 2014 | $1,278 | $61,312 | $16,760 | $44,552 |
Source: Public Records
Map
Nearby Homes
- 0 Cone Crescent Unit 10657334
- 10 Carmel Dr
- 208 Hill St
- 0 Green Ridge Ct Unit 40 8990863
- 0 Green Ridge Ct Unit SA344501
- 342 Savannah Ave
- 137 Blue Ridge Dr
- 6.24 ACRES E Olliff St
- 128 Blue Ridge Dr
- 203 Gentilly Rd
- 107 S Mulberry St
- 240 Donaldson St
- 502 Acorn Ln
- 0 Northside Dr E Unit 10610985
- 152 E Parrish St
- 0 Highway 67 Unit 10541885
- 403 Granade St
- 144 Griffith Ln
- 142 Griffith Ln
- 105 Griffith Ln Unit LOT 76
Your Personal Tour Guide
Ask me questions while you tour the home.