
Landlord's Agent in 2021
Lisa Burns
Compass RE
(610) 246-3026
5 in this area
16 Total Sales
Estimated Value: $723,816 - $849,000
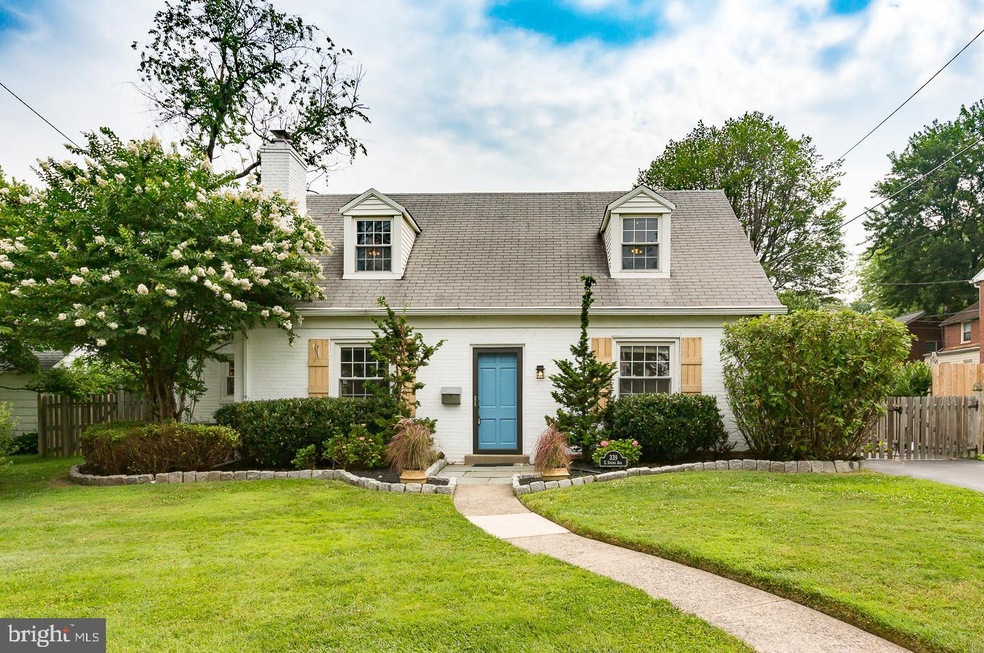
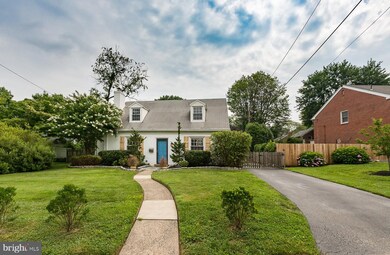
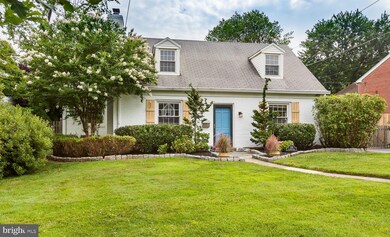
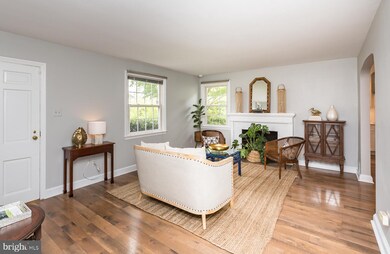
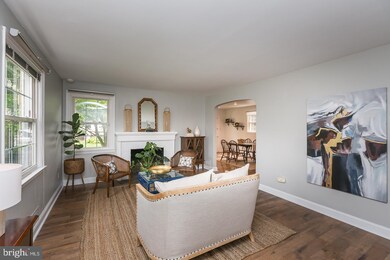
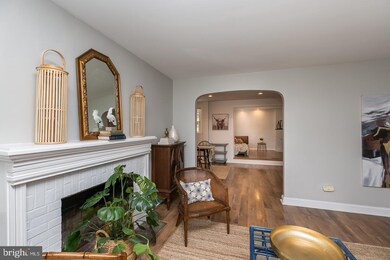
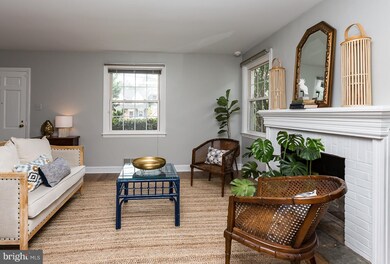
This recently renovated four-bedroom, two-bath Ardmore Park home sits within walking distance of all that this bustling town has to offer. A beautifully landscaped front yard and a gated driveway greet you when you arrive. The living area features newly installed Pergo Max laminate flooring which runs throughout the home. The eat-in kitchen was meticulously renovated with no detail left behind. From the opening of the floorplan to the Fabuwood cabinets and under-mount sink, this kitchen is truly a chef's delight. The premium cabinets are topped with quartz countertops and accented by premium Samsung appliances including a digital range, french door refrigerator with exterior ice/water, and dishwasher. This farmhouse-style kitchen is highlighted by recessed and under-cabinet lighting and is open to the large dining area. Just off the kitchen is a cobblestone porch, perfect for alfresco dining and entertaining, which overlooks the professionally manicured backyard.
The first floor hosts two large bedrooms with spacious closets, flooded with natural light from the large windows. Both bedrooms on this level enjoy use of a recently renovated full hall bath. Upstairs you will find two spacious bedrooms one featuring a large walk-in closet, the other with a play nook, making this a great nursery or home office, both enjoying use of a full hall bath. The home is also for sale.
Situated just north of South Ardmore Park, this home is one of the most sought-after sections of Admore and is located in the Lower Merion School District "choice" section. Just a few blocks from some of the best shops and restaurants Ardmore has to offer including Sam's Brick Oven Pizza and Carlino’s Market. 339 E Spring Ave is less than a 15-minute walk to the Wynnewood Rd light rail station and a 15-minute walk to the Ardmore Station in Suburban Square, making this a great home for commuters.
Last Agent to Rent the Property
(610) 822-3356 kenenochs@compass.com Compass RE Listed on: 09/08/2021
| Date | Buyer | Sale Price | Title Company |
|---|---|---|---|
| Esposito Randy | $435,000 | None Available | |
| Mager Richard C | $215,000 | -- | |
| Krieger Florence G | -- | -- |
| Date | Event | Price | List to Sale | Price per Sq Ft | Prior Sale |
|---|---|---|---|---|---|
| 09/22/2021 09/22/21 | Rented | $4,000 | +14.3% | -- | |
| 09/09/2021 09/09/21 | Off Market | $3,500 | -- | -- | |
| 09/08/2021 09/08/21 | For Rent | $3,500 | 0.0% | -- | |
| 07/14/2016 07/14/16 | Sold | $435,000 | -3.3% | $226 / Sq Ft | View Prior Sale |
| 06/09/2016 06/09/16 | Pending | -- | -- | -- | |
| 05/02/2016 05/02/16 | Price Changed | $450,000 | -5.3% | $234 / Sq Ft | |
| 04/10/2016 04/10/16 | For Sale | $475,000 | -- | $246 / Sq Ft |
| Year | Tax Paid | Tax Assessment Tax Assessment Total Assessment is a certain percentage of the fair market value that is determined by local assessors to be the total taxable value of land and additions on the property. | Land | Improvement |
|---|---|---|---|---|
| 2025 | $7,517 | $180,000 | $45,500 | $134,500 |
| 2024 | $7,517 | $180,000 | $45,500 | $134,500 |
| 2023 | $7,204 | $180,000 | $45,500 | $134,500 |
| 2022 | $7,070 | $180,000 | $45,500 | $134,500 |
| 2021 | $6,909 | $180,000 | $45,500 | $134,500 |
| 2020 | $6,741 | $180,000 | $45,500 | $134,500 |
| 2019 | $6,622 | $180,000 | $45,500 | $134,500 |
| 2018 | $6,622 | $180,000 | $45,500 | $134,500 |
| 2017 | $6,378 | $180,000 | $45,500 | $134,500 |
| 2016 | $6,308 | $180,000 | $45,500 | $134,500 |
| 2015 | $5,881 | $180,000 | $45,500 | $134,500 |
| 2014 | $5,881 | $180,000 | $45,500 | $134,500 |
Landlord's Agent in 2021
Lisa Burns
Compass RE
(610) 246-3026
5 in this area
16 Total Sales
Tenant's Agent in 2021
Alexandra Stanziani
Keller Williams Main Line
(610) 203-2762
8 in this area
81 Total Sales
Seller's Agent in 2016
Jack Aezen
Compass RE
(610) 662-1066
3 in this area
99 Total Sales
Seller Co-Listing Agent in 2016
Esther Aezen
Compass RE
(610) 909-3921
13 Total Sales
Buyer's Agent in 2016
Ronald Rodier
JG Real Estate
(215) 467-4100
1 Total Sale
Source: Bright MLS
MLS Number: PAMC2010708
APN: 40-00-55916-006
Disclaimer: Certain information contained herein is derived from information provided by parties other than Homes.com. All information provided is deemed reliable, but is not guaranteed to be accurate and should be independently verified.
![]() The data relating to real estate for sale on this website appears in part through the BRIGHT Internet Data Exchange program, a voluntary cooperative exchange of property listing data between licensed real estate brokerage firms, and is provided by BRIGHT through a licensing agreement.
The data relating to real estate for sale on this website appears in part through the BRIGHT Internet Data Exchange program, a voluntary cooperative exchange of property listing data between licensed real estate brokerage firms, and is provided by BRIGHT through a licensing agreement.
Listing information is from various brokers who participate in the Bright MLS IDX program and not all listings may be visible on the site.
The property information being provided on or through the website is for the personal, non-commercial use of consumers and such information may not be used for any purpose other than to identify prospective properties consumers may be interested in purchasing.
Some properties which appear for sale on the website may no longer be available because they are for instance, under contract, sold or are no longer being offered for sale.
Property information displayed is deemed reliable but is not guaranteed.
Copyright 2026 Bright MLS, Inc.
Ask me questions while you tour the home.