
Seller's Agent in 2020
Jonathon Curley
Compass
(781) 258-7996
4 in this area
51 Total Sales


Estimated Value: $611,834 - $685,000
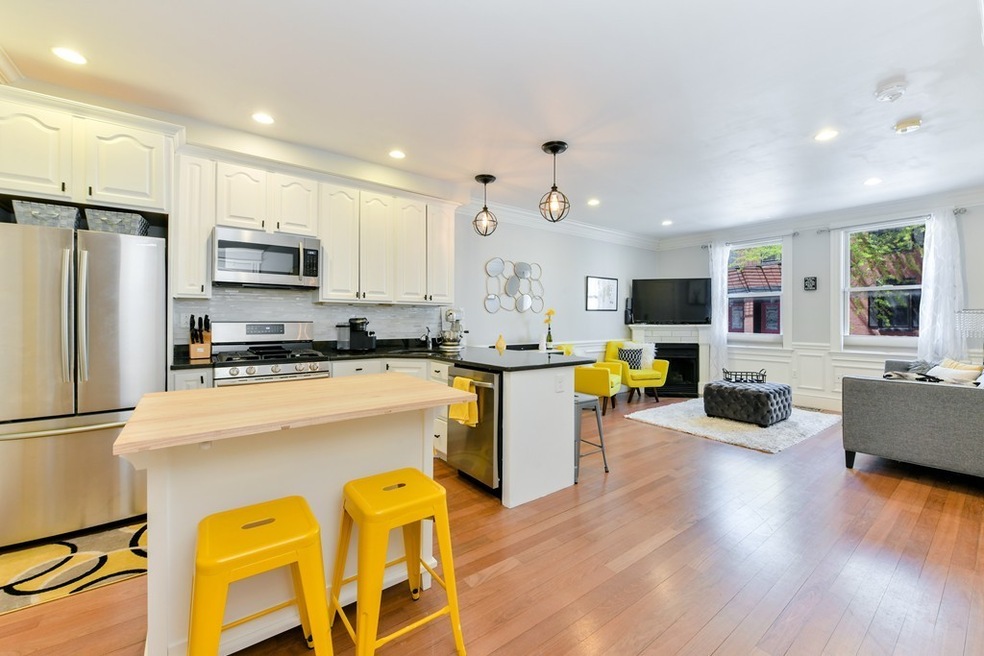
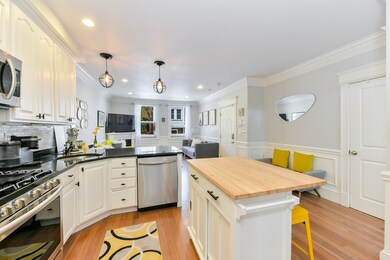
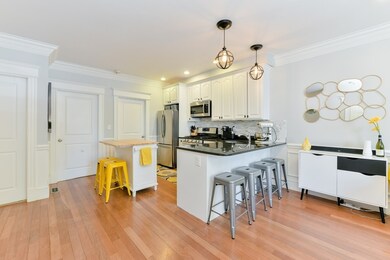
Rarely available in Southie for under 620k!!! This well thought out 2 bedroom condominium features a well appointed, renovated bath with jacuzzi tub, open-eat in kitchen with granite counter-tops, stainless steel appliances, white custom kitchen cabinetry and breakfast bar. Along with recently refinished hardwood floors, central air, in unit laundry, and impressive moldings and millwork throughout, this pet friendly association also features an exceptional amount of storage both inside the unit and a 10 X 12 exclusive storage area. To top it off this impressive condominium offers a private fenced-in outdoor oasis which is perfect for entertaining and for your furry friends. Being centrally located one block from West Broadway, short walk to sandy beaches, Seaport & public transit making this residence a perfect investment property or pied-a-terre. Very proactive association with high reserves.
| Date | Buyer | Sale Price | Title Company |
|---|---|---|---|
| Brennan Susan M | -- | None Available | |
| Mulrean Joan M | $610,000 | None Available | |
| Fleser Stacy | $565,000 | -- | |
| Curry Thomas | $476,500 | -- | |
| Wilkins Heather D | $400,000 | -- | |
| Benson Chelsea M | $320,000 | -- | |
| Croke Janine M | $295,000 | -- |
| Date | Status | Borrower | Loan Amount |
|---|---|---|---|
| Previous Owner | Fleser Stacy | $452,000 | |
| Previous Owner | Curry Thomas | $381,200 | |
| Previous Owner | Wilkins Heather D | $360,000 | |
| Previous Owner | Benson Chelsea M | $288,000 | |
| Previous Owner | Croke Janine M | $295,000 |
| Date | Event | Price | List to Sale | Price per Sq Ft | Prior Sale |
|---|---|---|---|---|---|
| 08/03/2020 08/03/20 | Sold | $610,000 | -1.6% | $893 / Sq Ft | |
| 06/01/2020 06/01/20 | Pending | -- | -- | -- | |
| 05/26/2020 05/26/20 | For Sale | $619,900 | +9.7% | $908 / Sq Ft | |
| 03/07/2019 03/07/19 | Sold | $565,000 | -1.7% | $827 / Sq Ft | View Prior Sale |
| 01/28/2019 01/28/19 | Pending | -- | -- | -- | |
| 01/07/2019 01/07/19 | For Sale | $575,000 | +20.7% | $842 / Sq Ft | |
| 06/15/2016 06/15/16 | Sold | $476,500 | +6.1% | $698 / Sq Ft | View Prior Sale |
| 04/06/2016 04/06/16 | Pending | -- | -- | -- | |
| 03/31/2016 03/31/16 | For Sale | $449,000 | +12.3% | $657 / Sq Ft | |
| 02/14/2014 02/14/14 | Sold | $400,000 | 0.0% | $563 / Sq Ft | View Prior Sale |
| 01/17/2014 01/17/14 | Pending | -- | -- | -- | |
| 12/20/2013 12/20/13 | Off Market | $400,000 | -- | -- | |
| 12/04/2013 12/04/13 | For Sale | $409,000 | +27.8% | $576 / Sq Ft | |
| 05/16/2012 05/16/12 | Sold | $320,000 | +0.3% | $469 / Sq Ft | View Prior Sale |
| 03/27/2012 03/27/12 | Pending | -- | -- | -- | |
| 03/07/2012 03/07/12 | Price Changed | $319,000 | +1.3% | $467 / Sq Ft | |
| 01/03/2012 01/03/12 | For Sale | $315,000 | -1.6% | $461 / Sq Ft | |
| 12/31/2011 12/31/11 | Off Market | $320,000 | -- | -- | |
| 10/25/2011 10/25/11 | Price Changed | $315,000 | -1.3% | $461 / Sq Ft | |
| 09/11/2011 09/11/11 | Price Changed | $319,000 | -1.8% | $467 / Sq Ft | |
| 07/24/2011 07/24/11 | For Sale | $324,900 | -- | $476 / Sq Ft |
| Year | Tax Paid | Tax Assessment Tax Assessment Total Assessment is a certain percentage of the fair market value that is determined by local assessors to be the total taxable value of land and additions on the property. | Land | Improvement |
|---|---|---|---|---|
| 2025 | $7,329 | $632,900 | $0 | $632,900 |
| 2024 | $6,702 | $614,900 | $0 | $614,900 |
| 2023 | $6,411 | $596,900 | $0 | $596,900 |
| 2022 | $6,306 | $579,600 | $0 | $579,600 |
| 2021 | $5,622 | $526,900 | $0 | $526,900 |
| 2020 | $5,186 | $491,100 | $0 | $491,100 |
| 2019 | $4,794 | $454,800 | $0 | $454,800 |
| 2018 | $4,497 | $429,100 | $0 | $429,100 |
| 2017 | $4,185 | $395,200 | $0 | $395,200 |
| 2016 | $4,140 | $376,400 | $0 | $376,400 |
| 2015 | $3,889 | $321,100 | $0 | $321,100 |
| 2014 | $3,605 | $286,600 | $0 | $286,600 |
Seller's Agent in 2020
Jonathon Curley
Compass
(781) 258-7996
4 in this area
51 Total Sales
Buyer's Agent in 2020
Michelle Talbot
Grove Property Group
(617) 596-1948
5 in this area
13 Total Sales
Seller's Agent in 2019
Emily Ingardia
Donnelly + Co.
(617) 480-9976
3 in this area
68 Total Sales
E
Seller Co-Listing Agent in 2019
Erin Loughran
Donnelly + Co.
(508) 265-8298
7 in this area
44 Total Sales
Seller's Agent in 2016
Poppy Troupe
Coldwell Banker Realty - Norwell - Hanover Regional Office
(617) 285-5684
220 Total Sales
Seller's Agent in 2014
Brian Montgomery
Compass
(617) 270-5598
1 in this area
13 Total Sales
Source: MLS Property Information Network (MLS PIN)
MLS Number: 72661544
APN: SBOS-000000-000006-001644-000002
Disclaimer: Certain information contained herein is derived from information provided by parties other than Homes.com. All information provided is deemed reliable, but is not guaranteed to be accurate and should be independently verified.
![]() The property listing data and information, or the Images, set forth herein were provided to MLS Property Information Network, Inc. from third party sources, including sellers, lessors and public records, and were compiled by MLS Property Information Network, Inc. The property listing data and information, and the Images, are for the personal, non-commercial use of consumers having a good faith interest in purchasing or leasing listed properties of the type displayed to them and may not be used for any purpose other than to identify prospective properties which such consumers may have a good faith interest in purchasing or leasing. MLS Property Information Network, Inc. and its subscribers disclaim any and all representations and warranties as to the accuracy of the property listing data and information, or as to the accuracy of any of the Images, set forth herein.
The property listing data and information, or the Images, set forth herein were provided to MLS Property Information Network, Inc. from third party sources, including sellers, lessors and public records, and were compiled by MLS Property Information Network, Inc. The property listing data and information, and the Images, are for the personal, non-commercial use of consumers having a good faith interest in purchasing or leasing listed properties of the type displayed to them and may not be used for any purpose other than to identify prospective properties which such consumers may have a good faith interest in purchasing or leasing. MLS Property Information Network, Inc. and its subscribers disclaim any and all representations and warranties as to the accuracy of the property listing data and information, or as to the accuracy of any of the Images, set forth herein.
Ask me questions while you tour the home.