339 Eddy Ave Joshua, TX 76058
Estimated Value: $253,161 - $401,000
3
Beds
2
Baths
1,405
Sq Ft
$214/Sq Ft
Est. Value
About This Home
This home is located at 339 Eddy Ave, Joshua, TX 76058 and is currently estimated at $300,790, approximately $214 per square foot. 339 Eddy Ave is a home located in Johnson County with nearby schools including H.D. Staples Elementary School, R C Loflin Middle School, and Joshua High School.
Ownership History
Date
Name
Owned For
Owner Type
Purchase Details
Closed on
Mar 3, 2016
Sold by
Blankenship David W
Bought by
Vy Hook Investments Llc
Current Estimated Value
Home Financials for this Owner
Home Financials are based on the most recent Mortgage that was taken out on this home.
Original Mortgage
$116,000
Outstanding Balance
$50,364
Interest Rate
3.81%
Mortgage Type
Commercial
Estimated Equity
$250,426
Purchase Details
Closed on
Jan 24, 2014
Sold by
Crowley Mary Lynn and Crowley Mary L
Bought by
Blankenship David W
Home Financials for this Owner
Home Financials are based on the most recent Mortgage that was taken out on this home.
Original Mortgage
$130,748
Interest Rate
4.47%
Mortgage Type
New Conventional
Create a Home Valuation Report for This Property
The Home Valuation Report is an in-depth analysis detailing your home's value as well as a comparison with similar homes in the area
Home Values in the Area
Average Home Value in this Area
Purchase History
| Date | Buyer | Sale Price | Title Company |
|---|---|---|---|
| Vy Hook Investments Llc | -- | None Available | |
| Blankenship David W | -- | None Available |
Source: Public Records
Mortgage History
| Date | Status | Borrower | Loan Amount |
|---|---|---|---|
| Open | Vy Hook Investments Llc | $116,000 | |
| Previous Owner | Blankenship David W | $130,748 |
Source: Public Records
Tax History Compared to Growth
Tax History
| Year | Tax Paid | Tax Assessment Tax Assessment Total Assessment is a certain percentage of the fair market value that is determined by local assessors to be the total taxable value of land and additions on the property. | Land | Improvement |
|---|---|---|---|---|
| 2025 | $5,553 | $263,291 | $45,000 | $218,291 |
| 2024 | $5,553 | $228,160 | $0 | $0 |
| 2023 | $4,232 | $190,133 | $45,000 | $145,133 |
| 2022 | $4,520 | $180,133 | $35,000 | $145,133 |
| 2021 | $4,307 | $170,133 | $25,000 | $145,133 |
| 2020 | $3,863 | $141,104 | $25,000 | $116,104 |
| 2019 | $4,059 | $141,104 | $25,000 | $116,104 |
| 2018 | $3,876 | $131,104 | $15,000 | $116,104 |
| 2017 | $3,874 | $131,104 | $15,000 | $116,104 |
| 2016 | $3,874 | $131,104 | $15,000 | $116,104 |
| 2015 | $1,381 | $131,104 | $15,000 | $116,104 |
| 2014 | $1,381 | $131,104 | $15,000 | $116,104 |
Source: Public Records
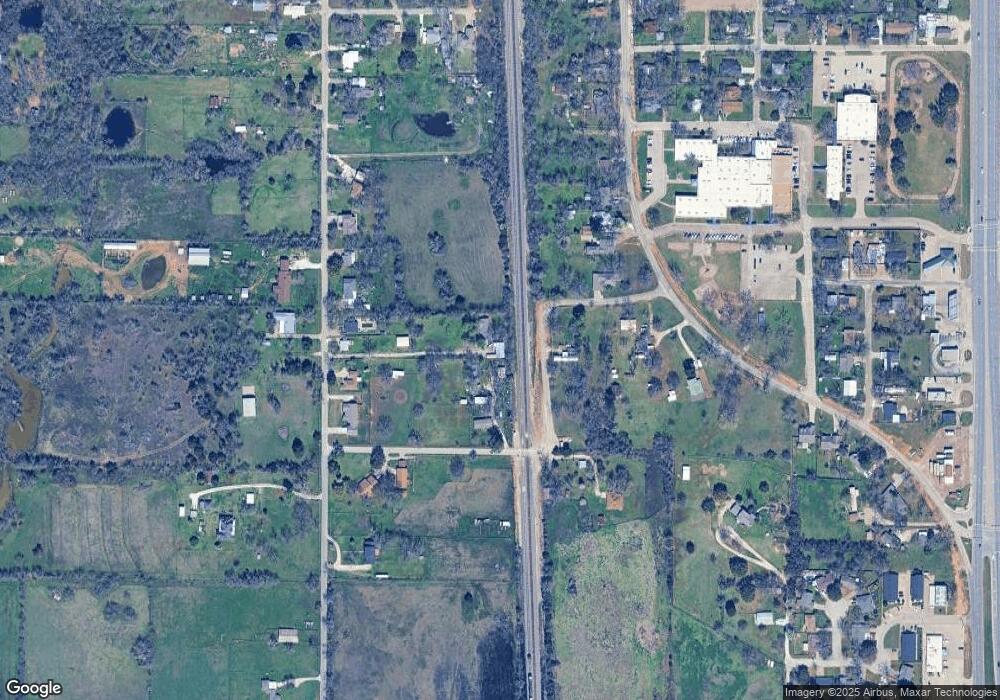
Map
Nearby Homes