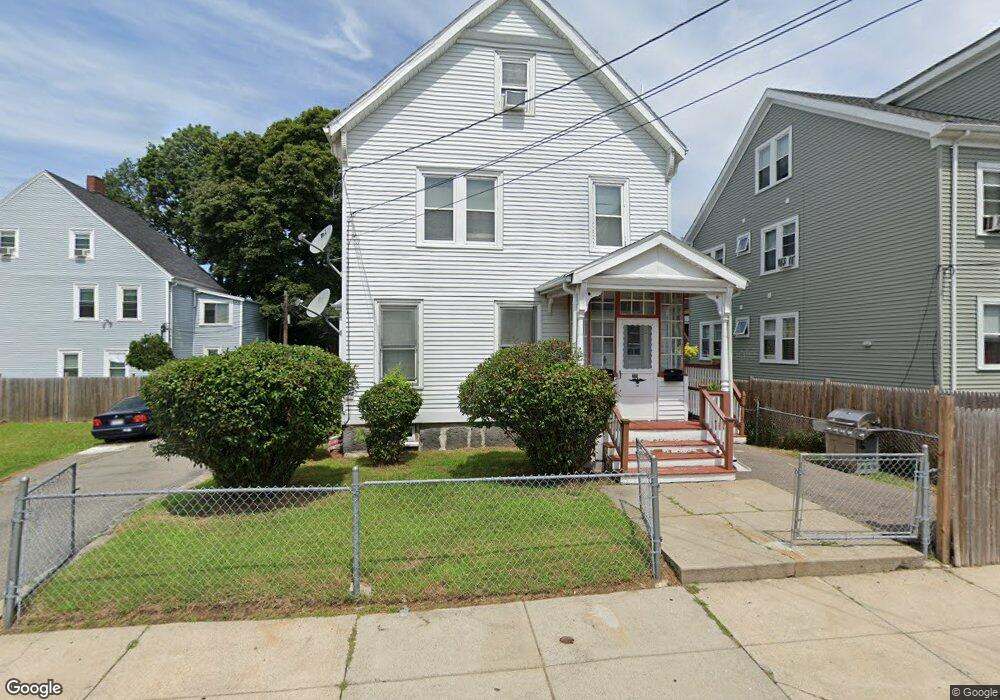
339 Fuller St Boston, MA 02124
West Codman Hill-West Lowe NeighborhoodEstimated Value: $836,000 - $978,461
4
Beds
1
Bath
2,878
Sq Ft
$315/Sq Ft
Est. Value
About This Home
This home is located at 339 Fuller St, Boston, MA 02124 and is currently estimated at $905,615, approximately $314 per square foot. 339 Fuller St is a home located in Suffolk County with nearby schools including Epiphany School.
Ownership History
Date
Name
Owned For
Owner Type
Purchase Details
Closed on
Aug 12, 2003
Sold by
Adler A Samuel Est
Bought by
Figaro Dianne B
Current Estimated Value
Home Financials for this Owner
Home Financials are based on the most recent Mortgage that was taken out on this home.
Original Mortgage
$308,750
Outstanding Balance
$132,590
Interest Rate
5.28%
Mortgage Type
Purchase Money Mortgage
Estimated Equity
$773,025
Create a Home Valuation Report for This Property
The Home Valuation Report is an in-depth analysis detailing your home's value as well as a comparison with similar homes in the area
Home Values in the Area
Average Home Value in this Area
Purchase History
| Date | Buyer | Sale Price | Title Company |
|---|---|---|---|
| Figaro Dianne B | $325,000 | -- |
Source: Public Records
Mortgage History
| Date | Status | Borrower | Loan Amount |
|---|---|---|---|
| Open | Figaro Dianne B | $308,750 |
Source: Public Records
Tax History Compared to Growth
Tax History
| Year | Tax Paid | Tax Assessment Tax Assessment Total Assessment is a certain percentage of the fair market value that is determined by local assessors to be the total taxable value of land and additions on the property. | Land | Improvement |
|---|---|---|---|---|
| 2025 | $9,405 | $812,200 | $373,000 | $439,200 |
| 2024 | $8,729 | $800,800 | $325,600 | $475,200 |
| 2023 | $7,890 | $734,600 | $298,700 | $435,900 |
| 2022 | $7,471 | $686,700 | $279,200 | $407,500 |
| 2021 | $6,542 | $613,100 | $249,300 | $363,800 |
| 2020 | $5,626 | $532,800 | $236,100 | $296,700 |
| 2019 | $5,483 | $520,200 | $193,500 | $326,700 |
| 2018 | $4,868 | $464,500 | $193,500 | $271,000 |
| 2017 | $4,777 | $451,100 | $193,500 | $257,600 |
| 2016 | $4,638 | $421,600 | $193,500 | $228,100 |
| 2015 | $4,446 | $367,100 | $143,600 | $223,500 |
| 2014 | $3,999 | $317,900 | $143,600 | $174,300 |
Source: Public Records
Map
Nearby Homes
- 124 Selden St
- 139 Selden St
- 808 Morton St Unit 3
- 15-17 W Selden St
- 32 Crowell St
- 30 Glenhill Rd
- 147 Fairmount St
- 44 Evans St
- 73 Stanton St
- 23 Maryknoll St
- 18 Astoria St
- 68 Mascot St
- 64 Stockton St
- 84-86 Codman Hill Ave
- 81 Mora St
- 183 Fuller St Unit 1
- 72 Mora St
- 56 Fairmount St Unit 2
- 36 Oakridge St
- 38 Mascot St Unit 3
- 339 Fuller St
- 335 Fuller St
- 964 Morton St
- 964 Morton St Unit 964 Morton St
- 964 Morton St
- 964 Morton St Unit 1
- 972-974 Morton St Unit 4
- 972 Morton St Unit 4
- 972-974 Morton St
- 972 Morton St
- 960 Morton St
- 331-333 Fuller St
- 331 Fuller St Unit 333
- 120 Selden St
- 327 Fuller St
- 956 Morton St
- 116 Selden St
- 953 Morton St Unit 955
- 953 Morton St Unit 2
- 957 Morton St