339 Huntington Dr Pittsboro, NC 27312
Estimated Value: $662,000 - $833,000
3
Beds
3
Baths
2,722
Sq Ft
$277/Sq Ft
Est. Value
About This Home
This home is located at 339 Huntington Dr, Pittsboro, NC 27312 and is currently estimated at $754,848, approximately $277 per square foot. 339 Huntington Dr is a home located in Chatham County with nearby schools including Perry W. Harrison Elementary School, Margaret B. Pollard Middle School, and Northwood High.
Ownership History
Date
Name
Owned For
Owner Type
Purchase Details
Closed on
Jan 10, 2018
Sold by
Branson Robin L and Branson David N
Bought by
Mcgirr William G and Mcgirr Michelle A
Current Estimated Value
Home Financials for this Owner
Home Financials are based on the most recent Mortgage that was taken out on this home.
Original Mortgage
$320,000
Outstanding Balance
$269,412
Interest Rate
3.94%
Mortgage Type
New Conventional
Estimated Equity
$485,436
Purchase Details
Closed on
Nov 15, 2007
Sold by
Mitchell John W and Mitchell Katherine C
Bought by
Branson Robin L and Branson David N
Home Financials for this Owner
Home Financials are based on the most recent Mortgage that was taken out on this home.
Original Mortgage
$232,000
Interest Rate
6.36%
Mortgage Type
Purchase Money Mortgage
Create a Home Valuation Report for This Property
The Home Valuation Report is an in-depth analysis detailing your home's value as well as a comparison with similar homes in the area
Home Values in the Area
Average Home Value in this Area
Purchase History
| Date | Buyer | Sale Price | Title Company |
|---|---|---|---|
| Mcgirr William G | $427,000 | None Available | |
| Branson Robin L | $290,000 | None Available |
Source: Public Records
Mortgage History
| Date | Status | Borrower | Loan Amount |
|---|---|---|---|
| Open | Mcgirr William G | $320,000 | |
| Previous Owner | Branson Robin L | $232,000 | |
| Previous Owner | Branson Robin L | $43,500 |
Source: Public Records
Tax History Compared to Growth
Tax History
| Year | Tax Paid | Tax Assessment Tax Assessment Total Assessment is a certain percentage of the fair market value that is determined by local assessors to be the total taxable value of land and additions on the property. | Land | Improvement |
|---|---|---|---|---|
| 2025 | $3,233 | $591,733 | $101,308 | $490,425 |
| 2024 | $3,233 | $414,699 | $84,423 | $330,276 |
| 2023 | $1,837 | $414,699 | $84,423 | $330,276 |
| 2022 | $1,686 | $414,699 | $84,423 | $330,276 |
| 2021 | $2,498 | $414,699 | $84,423 | $330,276 |
| 2020 | $2,424 | $399,356 | $101,308 | $298,048 |
| 2019 | $3,232 | $399,356 | $101,308 | $298,048 |
| 2018 | $3,045 | $399,356 | $101,308 | $298,048 |
| 2017 | $3,045 | $399,356 | $101,308 | $298,048 |
| 2016 | $3,067 | $388,254 | $101,308 | $286,946 |
| 2015 | $2,708 | $356,338 | $101,308 | $255,030 |
| 2014 | -- | $356,338 | $101,308 | $255,030 |
| 2013 | -- | $356,338 | $101,308 | $255,030 |
Source: Public Records
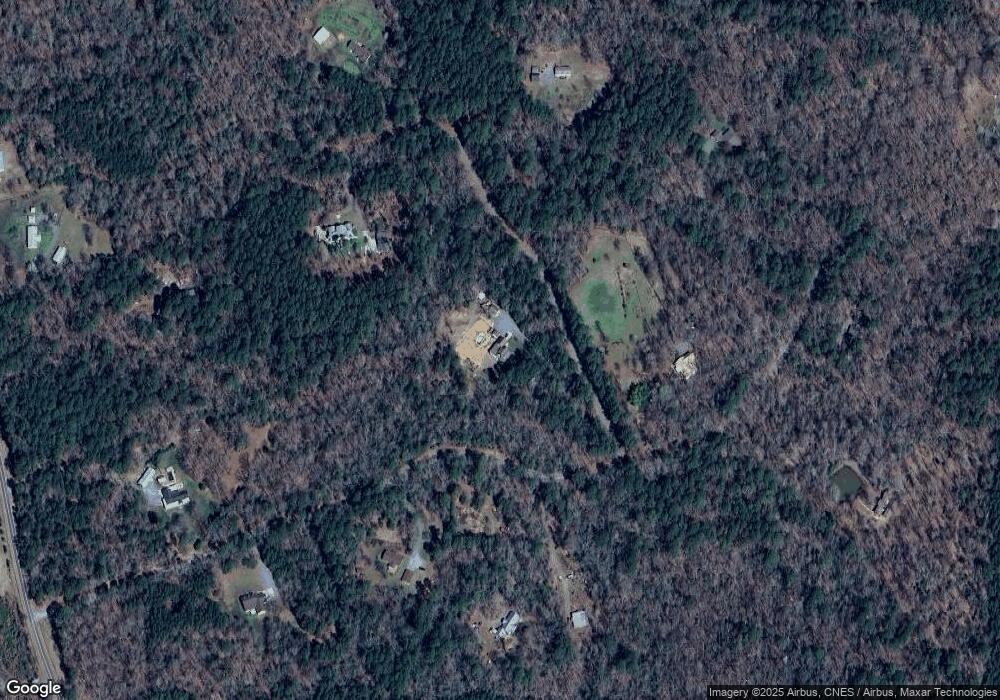
Map
Nearby Homes
- 97 Fox Oak Trail
- 304 Wrights Way
- 9402 N Carolina 87
- Tract C Chicken Bridge Rd
- Tract B Chicken Bridge Rd
- Tract A Chicken Bridge Rd
- 884 Windsor Rd
- 00 Bowman Bare Rd
- 000 Windsor Rd
- 46 Chetango Mountain Rd
- 0 Crawford Dairy Rd Unit 10090315
- 273 Blufftonwood Dr
- 36 Blufftonwood Dr
- 334 Blufftonwood Dr Unit 45
- 92 Bluffside Ct
- 0 Pete Thomas Rd
- 140 Blufftonwood Dr
- 164 Blufftonwood Dr Unit 35
- 4322 Russell Rd
- 915 Cabin Creek
- 0 Huntington Dr Unit 2012118
- 0 Huntington Dr Unit 624762
- 0 Huntington Dr Unit Lot 5 TR2012118
- 348 Huntington Dr
- 489 Huntington Dr
- 165 Fox Croft Dr
- 165 Foxcroft Dr
- 206 Huntington Dr
- 343 Huntington Dr
- 144 Rowland Dr
- 525 Huntington Dr
- 110 Fox Croft Dr
- 110 Foxcroft Dr
- 1610 Mount Olive Church Rd
- 98 Huntington Dr
- 95 Huntington Dr
- 428 Huntington Dr
- 380 Huntington Dr
- 498 Huntington Dr
- tbd Mt Olive Church Rd