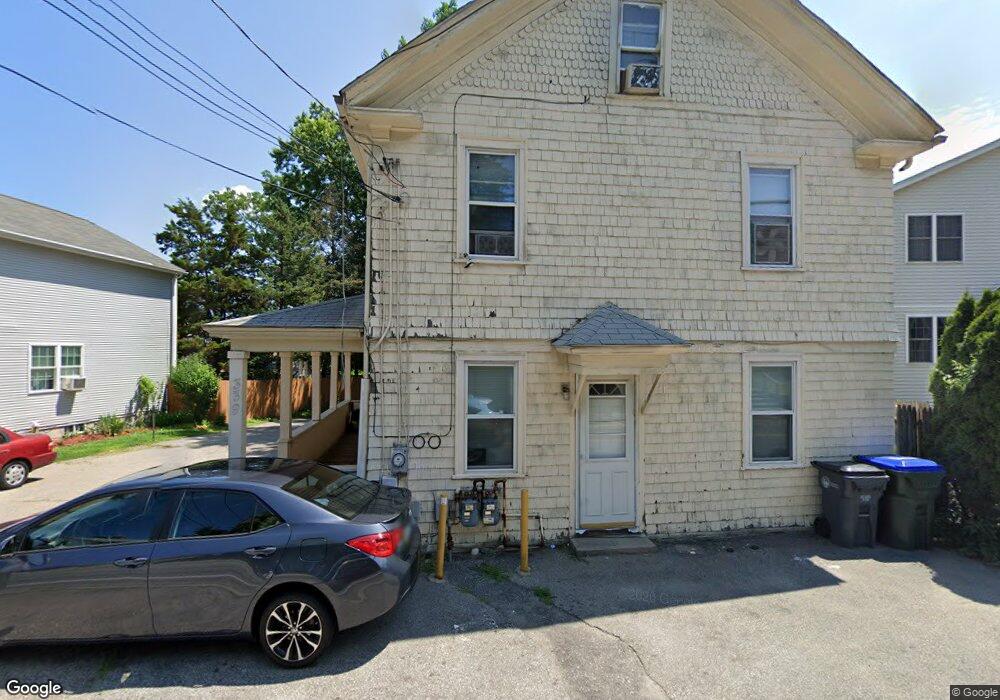
339 Killingly St Providence, RI 02909
Hartford NeighborhoodEstimated Value: $342,772 - $566,000
4
Beds
3
Baths
1,958
Sq Ft
$235/Sq Ft
Est. Value
About This Home
This home is located at 339 Killingly St, Providence, RI 02909 and is currently estimated at $460,443, approximately $235 per square foot. 339 Killingly St is a home located in Providence County with nearby schools including Charles N. Fortes Elementary School, Asa Messer Elementary School, and Laurel Hill Annex School.
Ownership History
Date
Name
Owned For
Owner Type
Purchase Details
Closed on
Jan 13, 2004
Sold by
Cassisi Frank and Cassisi Domenico
Bought by
Lopez Martin
Current Estimated Value
Home Financials for this Owner
Home Financials are based on the most recent Mortgage that was taken out on this home.
Original Mortgage
$156,750
Interest Rate
5.88%
Mortgage Type
Purchase Money Mortgage
Purchase Details
Closed on
Oct 15, 2003
Sold by
Goodman George and Maglione Domenic F
Bought by
Cassisi Frank and Cassisi Domenico
Create a Home Valuation Report for This Property
The Home Valuation Report is an in-depth analysis detailing your home's value as well as a comparison with similar homes in the area
Home Values in the Area
Average Home Value in this Area
Purchase History
| Date | Buyer | Sale Price | Title Company |
|---|---|---|---|
| Lopez Martin | $165,000 | -- | |
| Cassisi Frank | $160,000 | -- |
Source: Public Records
Mortgage History
| Date | Status | Borrower | Loan Amount |
|---|---|---|---|
| Open | Cassisi Frank | $186,450 | |
| Closed | Cassisi Frank | $156,750 |
Source: Public Records
Tax History Compared to Growth
Tax History
| Year | Tax Paid | Tax Assessment Tax Assessment Total Assessment is a certain percentage of the fair market value that is determined by local assessors to be the total taxable value of land and additions on the property. | Land | Improvement |
|---|---|---|---|---|
| 2025 | $3,178 | $420,900 | $144,200 | $276,700 |
| 2024 | $5,125 | $279,300 | $91,200 | $188,100 |
| 2023 | $5,125 | $279,300 | $91,200 | $188,100 |
| 2022 | $4,972 | $279,300 | $91,200 | $188,100 |
| 2021 | $3,883 | $158,100 | $56,200 | $101,900 |
| 2020 | $3,883 | $158,100 | $56,200 | $101,900 |
| 2019 | $3,883 | $158,100 | $56,200 | $101,900 |
| 2018 | $3,372 | $105,500 | $47,900 | $57,600 |
| 2017 | $3,372 | $105,500 | $47,900 | $57,600 |
| 2016 | $3,372 | $105,500 | $47,900 | $57,600 |
| 2015 | $3,082 | $93,100 | $47,900 | $45,200 |
| 2014 | $3,142 | $93,100 | $47,900 | $45,200 |
| 2013 | $3,142 | $93,100 | $47,900 | $45,200 |
Source: Public Records
Map
Nearby Homes
- 17 Middleton St
- 6 Seton St
- 10 Mott St
- 60 Ophelia St
- 102 Ophelia St
- 0 Orchard St Unit 1396400
- 0 Orchard St Unit 1400488
- 0 Orchard St Unit 1395201
- 0 Central Ave Unit 1398155
- 33 Harding Ave
- 27 Aurelia Dr
- 8 Summit Ave
- 10 S Long St
- 19 S Long St
- 14 Whittlesey Rd
- 150 Central Ave
- 15 Melissa St
- 129 Glenbridge Ave
- 138 Glenbridge Ave
- 162 Merino St
- 343 Killingly St
- 329 Killingly St
- 331 Killingly St
- 34 Milo St
- 349 Killingly St
- 30 Milo St
- 26 Milo St
- 42 Milo St
- 22 Milo St
- 336 - Unith Killingly St Unit H
- 323 Killingly St
- 50 Milo St
- 18 Milo St
- 348 Killingly St
- 688 Hartford Ave
- 336 Killingly St Unit J
- 336 Killingly St Unit A
- 336 Killingly St Unit H
- 336 Killingly St Unit G
- 336 Killingly St Unit D