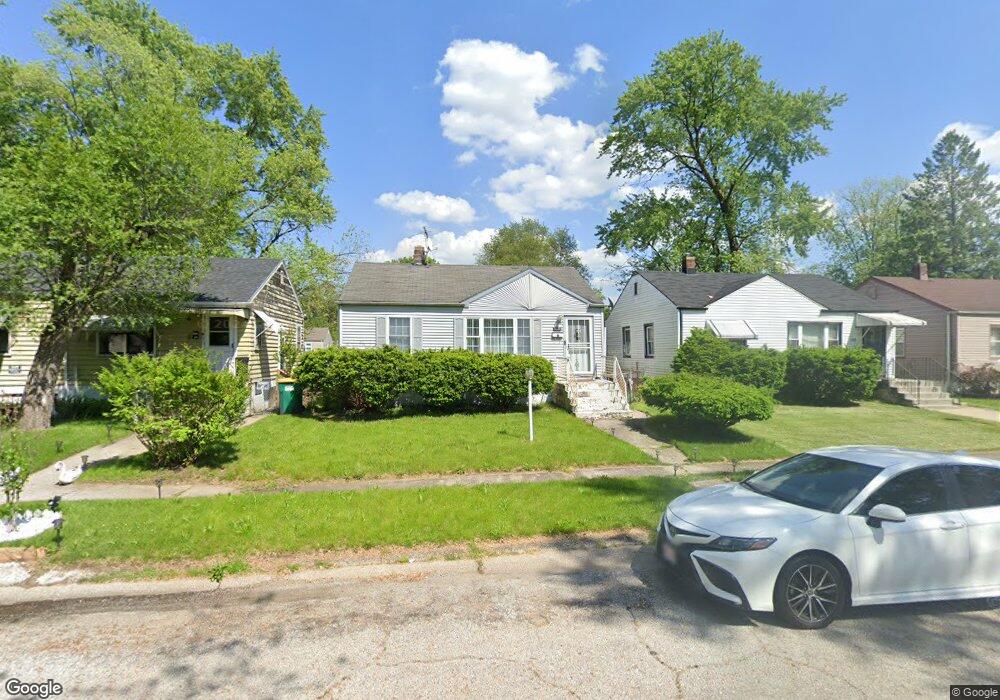
339 King St Gary, IN 46406
Brunswick NeighborhoodEstimated Value: $73,659 - $165,000
2
Beds
2
Baths
880
Sq Ft
$129/Sq Ft
Est. Value
About This Home
This home is located at 339 King St, Gary, IN 46406 and is currently estimated at $113,915, approximately $129 per square foot. 339 King St is a home located in Lake County with nearby schools including Bailly Preparatory Academy, West Side Leadership Academy, and Gary Lighthouse Charter School.
Ownership History
Date
Name
Owned For
Owner Type
Purchase Details
Closed on
Aug 16, 2020
Sold by
Edwards Andre
Bought by
L & A Property Management Llc
Current Estimated Value
Purchase Details
Closed on
Jan 30, 2013
Sold by
Edwards Henry
Bought by
Edwards Mable
Purchase Details
Closed on
Sep 16, 2009
Sold by
The Bank Of New York Mellon
Bought by
Edwards Henry
Purchase Details
Closed on
Aug 21, 2009
Sold by
Wells Fargo Bank Na
Bought by
The Bank Of New York Mellon and The Bank Of New York
Purchase Details
Closed on
Aug 7, 2009
Sold by
Sparks Johnny
Bought by
Wells Fargo Bank Na
Create a Home Valuation Report for This Property
The Home Valuation Report is an in-depth analysis detailing your home's value as well as a comparison with similar homes in the area
Home Values in the Area
Average Home Value in this Area
Purchase History
| Date | Buyer | Sale Price | Title Company |
|---|---|---|---|
| L & A Property Management Llc | -- | None Listed On Document | |
| Edwards Mable | -- | None Available | |
| Edwards Henry | -- | Meridian Title Corp | |
| The Bank Of New York Mellon | -- | None Available | |
| Wells Fargo Bank Na | $10,800 | None Available |
Source: Public Records
Tax History
| Year | Tax Paid | Tax Assessment Tax Assessment Total Assessment is a certain percentage of the fair market value that is determined by local assessors to be the total taxable value of land and additions on the property. | Land | Improvement |
|---|---|---|---|---|
| 2025 | $1,016 | $39,300 | $7,000 | $32,300 |
| 2024 | $2,954 | $35,600 | $7,000 | $28,600 |
| 2023 | $861 | $33,500 | $7,000 | $26,500 |
| 2022 | $861 | $33,600 | $4,100 | $29,500 |
| 2021 | $797 | $31,100 | $4,100 | $27,000 |
| 2020 | $766 | $29,900 | $4,100 | $25,800 |
| 2019 | $755 | $29,200 | $4,100 | $25,100 |
| 2018 | $801 | $29,900 | $4,100 | $25,800 |
| 2017 | $715 | $30,300 | $4,100 | $26,200 |
| 2016 | $731 | $31,500 | $4,100 | $27,400 |
| 2014 | $868 | $37,100 | $5,000 | $32,100 |
| 2013 | $329 | $36,000 | $5,000 | $31,000 |
Source: Public Records
Map
Nearby Homes
- 278 Hamlin St
- 273 Hamlin St
- 263 Hamlin St
- 451 Hamlin St
- 238 Hamlin St
- 456 Gerry St
- 556 Gerry St
- 629 Hamlin St
- 621 Burr St
- 364 Durbin St
- 801 Hobart St
- 809 Clinton St
- 984 Stevenson St
- 349 Hamlin St
- 1024 Ralston St Unit 30
- 1124 Clinton St
- 1140 Clinton St
- 1045 - 1051 Durbin St
- 5438 W 15th Ave
- 4408 W 10th Ave
Your Personal Tour Guide
Ask me questions while you tour the home.