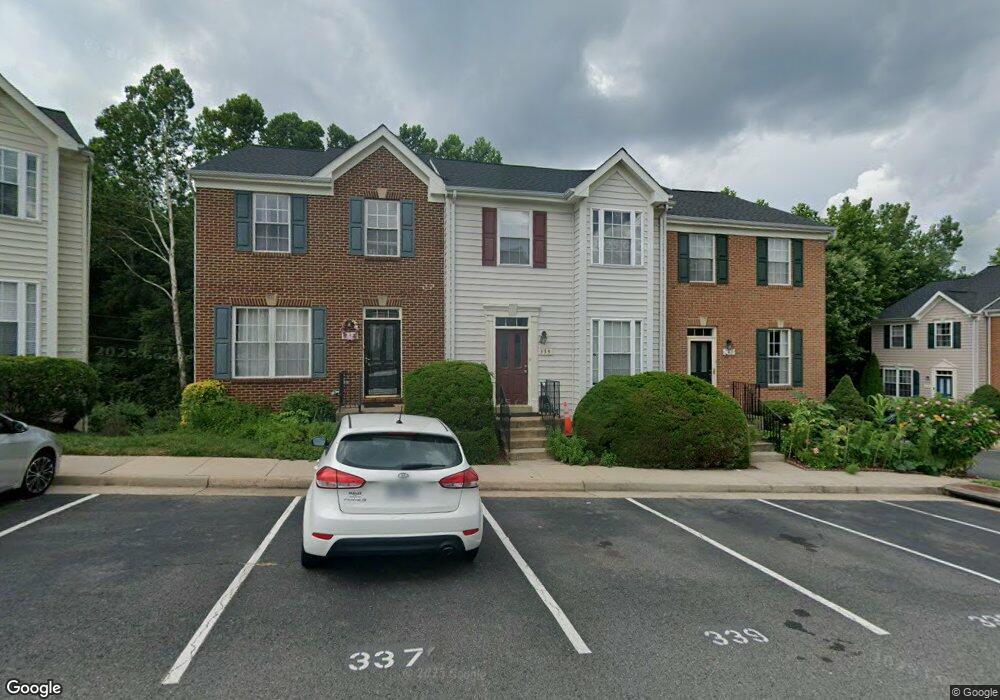
339 Kirby St Unit 71 Manassas Park, VA 20111
Estimated Value: $417,837 - $442,000
4
Beds
4
Baths
1,984
Sq Ft
$215/Sq Ft
Est. Value
About This Home
This home is located at 339 Kirby St Unit 71, Manassas Park, VA 20111 and is currently estimated at $426,459, approximately $214 per square foot. 339 Kirby St Unit 71 is a home located in Manassas Park City with nearby schools including Cougar Elementary School, Manassas Park Elementary School, and Manassas Park Middle School.
Ownership History
Date
Name
Owned For
Owner Type
Purchase Details
Closed on
Nov 29, 2009
Sold by
Wells Fargo Bank Na
Bought by
Liu Jin and Gu Yiwen
Current Estimated Value
Home Financials for this Owner
Home Financials are based on the most recent Mortgage that was taken out on this home.
Original Mortgage
$117,000
Outstanding Balance
$76,744
Interest Rate
5.01%
Estimated Equity
$349,715
Purchase Details
Closed on
Sep 30, 2009
Sold by
Mortgage Electronic Registration Systems
Bought by
Wells Fargo Bank Na
Home Financials for this Owner
Home Financials are based on the most recent Mortgage that was taken out on this home.
Original Mortgage
$117,000
Outstanding Balance
$76,744
Interest Rate
5.01%
Estimated Equity
$349,715
Purchase Details
Closed on
May 18, 2009
Sold by
Paucar Carlos A and Avendano Patricia M
Bought by
Federal National Mortgage Association
Create a Home Valuation Report for This Property
The Home Valuation Report is an in-depth analysis detailing your home's value as well as a comparison with similar homes in the area
Home Values in the Area
Average Home Value in this Area
Purchase History
| Date | Buyer | Sale Price | Title Company |
|---|---|---|---|
| Liu Jin | $156,100 | Cltic | |
| Wells Fargo Bank Na | -- | None Available | |
| Federal National Mortgage Association | $296,676 | None Available |
Source: Public Records
Mortgage History
| Date | Status | Borrower | Loan Amount |
|---|---|---|---|
| Open | Liu Jin | $117,000 |
Source: Public Records
Tax History Compared to Growth
Tax History
| Year | Tax Paid | Tax Assessment Tax Assessment Total Assessment is a certain percentage of the fair market value that is determined by local assessors to be the total taxable value of land and additions on the property. | Land | Improvement |
|---|---|---|---|---|
| 2025 | $4,497 | $378,300 | $79,800 | $298,500 |
| 2024 | $4,497 | $343,900 | $79,800 | $264,100 |
| 2023 | $4,497 | $325,900 | $76,000 | $249,900 |
| 2022 | $4,235 | $304,600 | $72,400 | $232,200 |
| 2021 | $4,049 | $271,900 | $62,900 | $209,000 |
| 2020 | $3,788 | $256,500 | $59,300 | $197,200 |
| 2019 | $3,788 | $239,700 | $54,400 | $185,300 |
| 2018 | $3,191 | $221,900 | $54,400 | $167,500 |
| 2017 | $3,139 | $205,400 | $54,400 | $151,000 |
| 2016 | $3,120 | $201,300 | $54,400 | $146,900 |
| 2015 | $2,692 | $201,300 | $54,400 | $146,900 |
| 2014 | $2,692 | $162,000 | $54,400 | $107,600 |
Source: Public Records
Map
Nearby Homes
- 185 Cabbel Dr
- 135 Polk Dr
- 9058 Old Hickory Ct
- 8494 Kirby St
- 9022 New Britain Cir
- 230 Cabbel Dr
- 8396 Woodline Ct
- 8572 King Carter St
- 305 Moseby Ct
- 8334 Shady Grove Cir
- 248 Manassas Dr
- 8584 Liberia Ave
- 259 Moseby Dr
- 132 Evans St
- 8347 Ivy Glen Ct
- 9188 Laurelwood Ct
- 9274 Bayberry Ave
- 8516 Cavalry Ln
- 8275 Vermont Place
- 167 Scott Dr