Estimated Value: $111,000 - $135,000
2
Beds
2
Baths
1,200
Sq Ft
$101/Sq Ft
Est. Value
About This Home
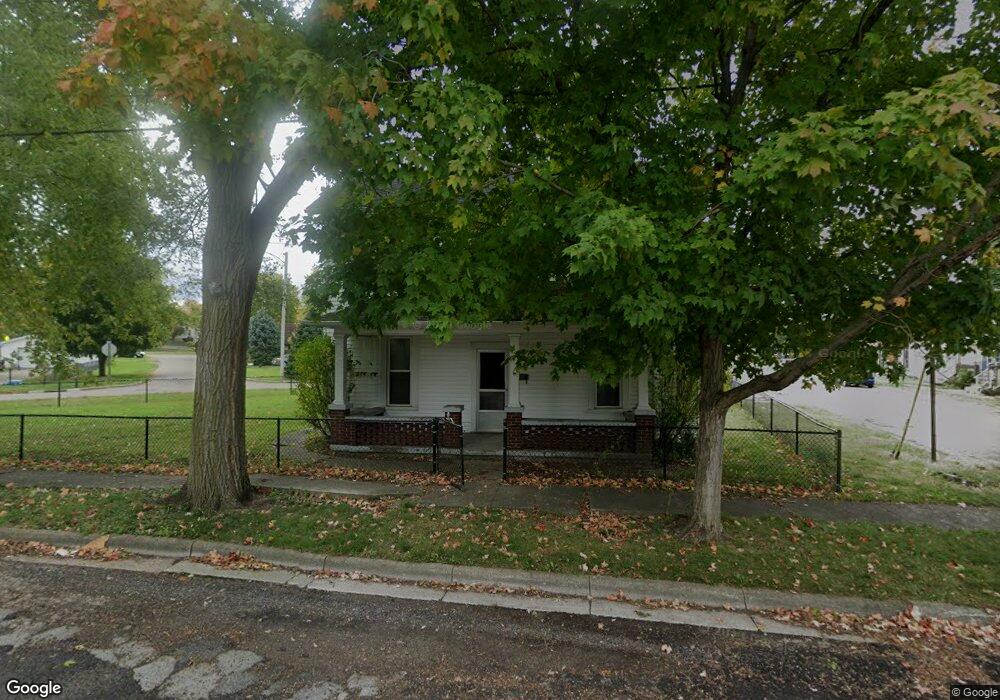
This home is located at 339 Locust St, Xenia, OH 45385 and is currently estimated at $121,667, approximately $101 per square foot. 339 Locust St is a home located in Greene County with nearby schools including Xenia High School, Summit Academy Community School for Alternative Learners - Xenia, and Legacy Christian Academy.
Ownership History
Date
Name
Owned For
Owner Type
Purchase Details
Closed on
Oct 11, 2022
Sold by
Baker Jason
Bought by
Clevenger Phillip A
Current Estimated Value
Purchase Details
Closed on
Nov 24, 2021
Sold by
Boyette George O and Boyette Kendra Elaine
Bought by
Baker Jason D
Purchase Details
Closed on
Jan 14, 2002
Sold by
Banks Darvin L
Bought by
Boyette George O
Home Financials for this Owner
Home Financials are based on the most recent Mortgage that was taken out on this home.
Original Mortgage
$58,580
Interest Rate
7.26%
Purchase Details
Closed on
May 17, 1996
Sold by
Schickling Sandra L
Bought by
Banks Darvin L
Create a Home Valuation Report for This Property
The Home Valuation Report is an in-depth analysis detailing your home's value as well as a comparison with similar homes in the area
Home Values in the Area
Average Home Value in this Area
Purchase History
| Date | Buyer | Sale Price | Title Company |
|---|---|---|---|
| Clevenger Phillip A | $6,000,000 | -- | |
| Baker Jason D | $60,000 | None Available | |
| Boyette George O | $14,875 | -- | |
| Banks Darvin L | $45,000 | -- |
Source: Public Records
Mortgage History
| Date | Status | Borrower | Loan Amount |
|---|---|---|---|
| Previous Owner | Boyette George O | $58,580 |
Source: Public Records
Tax History Compared to Growth
Tax History
| Year | Tax Paid | Tax Assessment Tax Assessment Total Assessment is a certain percentage of the fair market value that is determined by local assessors to be the total taxable value of land and additions on the property. | Land | Improvement |
|---|---|---|---|---|
| 2024 | $1,332 | $31,120 | $4,740 | $26,380 |
| 2023 | $1,332 | $31,120 | $4,740 | $26,380 |
| 2022 | $1,269 | $20,360 | $3,790 | $16,570 |
| 2021 | $1,167 | $23,520 | $3,790 | $19,730 |
| 2020 | $1,117 | $23,520 | $3,790 | $19,730 |
| 2019 | $1,056 | $20,940 | $4,160 | $16,780 |
| 2018 | $1,059 | $20,940 | $4,160 | $16,780 |
| 2017 | $1,078 | $20,940 | $4,160 | $16,780 |
| 2016 | $1,079 | $20,920 | $4,160 | $16,760 |
| 2015 | $1,082 | $20,920 | $4,160 | $16,760 |
| 2014 | $1,035 | $20,920 | $4,160 | $16,760 |
Source: Public Records
Map
Nearby Homes