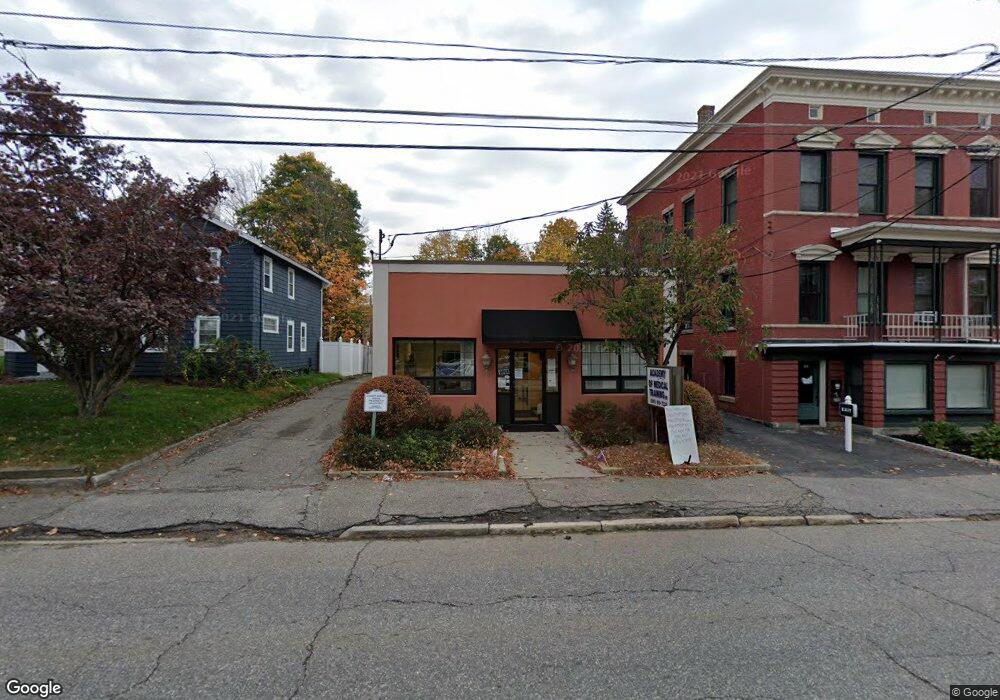
339 Main St Torrington, CT 06790
Estimated Value: $286,565
Studio
--
Bath
2,028
Sq Ft
$141/Sq Ft
Est. Value
About This Home
This home is located at 339 Main St, Torrington, CT 06790 and is currently estimated at $286,565, approximately $141 per square foot. 339 Main St is a home located in Litchfield County with nearby schools including Torrington Middle School and Torrington High School.
Ownership History
Date
Name
Owned For
Owner Type
Purchase Details
Closed on
Mar 18, 2022
Sold by
Torrington Area Health
Bought by
339 Main Street Llc
Current Estimated Value
Home Financials for this Owner
Home Financials are based on the most recent Mortgage that was taken out on this home.
Original Mortgage
$150,000
Outstanding Balance
$140,148
Interest Rate
3.92%
Mortgage Type
Commercial
Estimated Equity
$146,417
Create a Home Valuation Report for This Property
The Home Valuation Report is an in-depth analysis detailing your home's value as well as a comparison with similar homes in the area
Home Values in the Area
Average Home Value in this Area
Purchase History
| Date | Buyer | Sale Price | Title Company |
|---|---|---|---|
| 339 Main Street Llc | $200,000 | None Available | |
| 339 Main Street Llc | $200,000 | None Available |
Source: Public Records
Mortgage History
| Date | Status | Borrower | Loan Amount |
|---|---|---|---|
| Open | 339 Main Street Llc | $150,000 | |
| Closed | 339 Main Street Llc | $150,000 |
Source: Public Records
Tax History
| Year | Tax Paid | Tax Assessment Tax Assessment Total Assessment is a certain percentage of the fair market value that is determined by local assessors to be the total taxable value of land and additions on the property. | Land | Improvement |
|---|---|---|---|---|
| 2025 | $8,430 | $219,240 | $35,700 | $183,540 |
| 2024 | $10,397 | $216,730 | $42,380 | $174,350 |
| 2023 | $10,394 | $216,730 | $42,380 | $174,350 |
| 2022 | $5,822 | $123,510 | $42,380 | $81,130 |
| 2021 | $5,702 | $123,510 | $42,380 | $81,130 |
| 2020 | $5,702 | $123,510 | $42,380 | $81,130 |
| 2019 | $5,591 | $121,090 | $40,530 | $80,560 |
| 2018 | $5,591 | $121,090 | $40,530 | $80,560 |
| 2017 | $5,540 | $121,090 | $40,530 | $80,560 |
| 2016 | $5,540 | $121,090 | $40,530 | $80,560 |
| 2015 | $5,540 | $121,090 | $40,530 | $80,560 |
| 2014 | -- | $141,980 | $52,970 | $89,010 |
Source: Public Records
Map
Nearby Homes
- 291 E Main St
- 116 Hillside Ave
- 279 E Elm St
- 19 Harwinton Ave
- 408 Main St
- 444 Prospect St
- 238 Barton St
- 277 Brightwood Ave
- 00 Winthrop St & E Elm St
- 118 Pearl St
- 195 Torrington Heights Rd
- 83 Birge St
- 00 Church St
- 42 Pulver St
- 409 Brightwood Ave
- 23 Benham St
- 118 Migeon Ave
- 682 Main St
- 130 N Elm St
- 68 Wilson Ave Unit 103
- 345 E Main St
- 52 Britton Ave
- 48 Britton Ave
- 48 Britton Ave Unit 2
- 48 Britton Ave Unit 1
- 305 E Main St
- 42 Britton Ave
- 32 Britton Ave Unit 2
- 32 Britton Ave Unit 2
- 36 Britton Ave
- 314 E Main St
- 24 Britton Ave
- 67 Britton Ave
- 301 E Main St
- 18 Britton Ave
- 312 E Main St
- 295 E Main St
- 17 Britton Ave
- 296 E Main St
- 11 Britton 2nd Floor Ave
Your Personal Tour Guide
Ask me questions while you tour the home.