339 Main St Torrington, CT 06790
Estimated Value: $281,457
About This Home
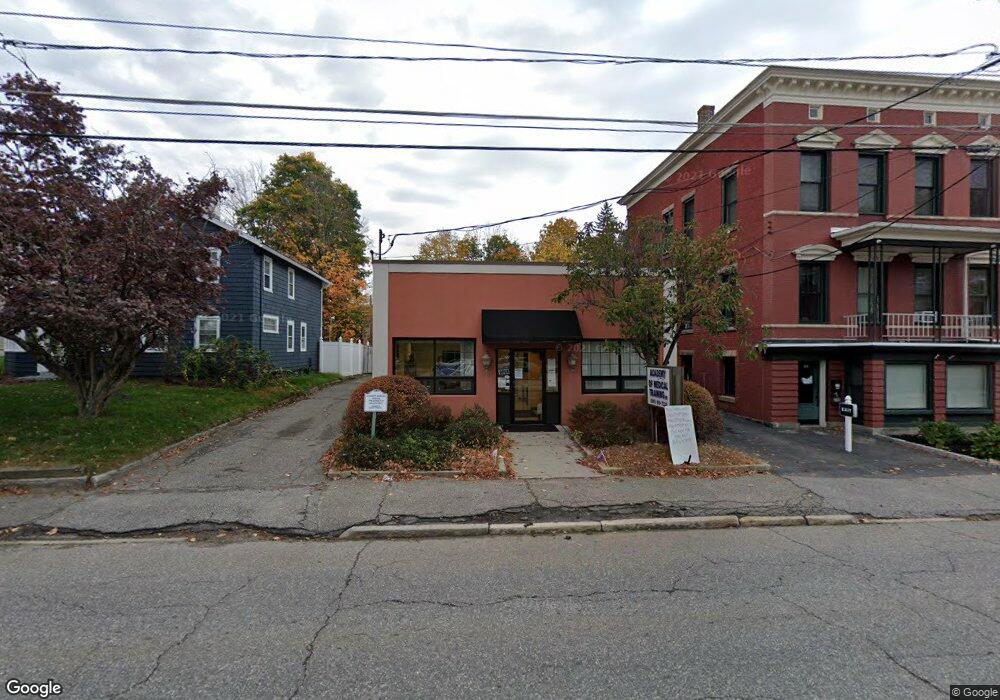
This home is located at 339 Main St, Torrington, CT 06790 and is currently estimated at $281,457, approximately $138 per square foot. 339 Main St is a home located in Litchfield County with nearby schools including Torrington Middle School and Torrington High School.
Ownership History
We collect this data history from publicly available records. To have your information removed, we recommend requesting removal directly through your county’s website.
Purchase Details
Home Financials for this Owner
Home Financials are based on the most recent Mortgage that was taken out on this home.Home Values in the Area
Average Home Value in this Area
Purchase History
We collect this data history from publicly available records. To have your information removed, we recommend requesting removal directly through your county’s website.
| Date | Buyer | Sale Price | Title Company |
|---|---|---|---|
| $200,000 | None Available | ||
| $200,000 | None Available |
Mortgage History
We collect this data history from publicly available records. To have your information removed, we recommend requesting removal directly through your county’s website.
| Date | Status | Borrower | Loan Amount |
|---|---|---|---|
| Open | $150,000 | ||
| Closed | $150,000 |
Tax History
We collect this data history from publicly available records. To have your information removed, we recommend requesting removal directly through your county’s website.
| Year | Tax Paid | Tax Assessment Tax Assessment Total Assessment is a certain percentage of the fair market value that is determined by local assessors to be the total taxable value of land and additions on the property. | Land | Improvement |
|---|---|---|---|---|
| 2025 | $8,430 | $219,240 | $35,700 | $183,540 |
| 2024 | $10,397 | $216,730 | $42,380 | $174,350 |
| 2023 | $10,394 | $216,730 | $42,380 | $174,350 |
| 2022 | $5,822 | $123,510 | $42,380 | $81,130 |
| 2021 | $5,702 | $123,510 | $42,380 | $81,130 |
| 2020 | $5,702 | $123,510 | $42,380 | $81,130 |
| 2019 | $5,591 | $121,090 | $40,530 | $80,560 |
| 2018 | $5,591 | $121,090 | $40,530 | $80,560 |
| 2017 | $5,540 | $121,090 | $40,530 | $80,560 |
| 2016 | $5,540 | $121,090 | $40,530 | $80,560 |
| 2015 | $5,540 | $121,090 | $40,530 | $80,560 |
| 2014 | -- | $141,980 | $52,970 | $89,010 |
Map
- 218 E Pearl St
- 118 Patterson St
- 17 Kinney St
- 125 Patterson St
- 46 Pleasant St
- 52 E Pearl St
- 10 E Pearl St
- 231 Patterson St
- 86 Bird St
- 53 Harwinton Ave Unit 3
- 408 Main St
- 524 Prospect St
- 443 Main St
- 102 Pearl St
- 29 Whiting Ave
- 327 Hillside Ave Unit 11
- 0 Prospect St
- 00 Winthrop St & E Elm St
- 20 Prospect Place
- 392 Hillside Ave
- 36 Britton Ave
- 42 Britton Ave
- 32 Britton Ave Unit 2
- 32 Britton Ave Unit 2
- 305 E Main St
- 48 Britton Ave
- 48 Britton Ave Unit 2
- 48 Britton Ave Unit 1
- 24 Britton Ave
- 52 Britton Ave
- 18 Britton Ave
- 301 E Main St
- 17 Britton Ave
- 11 Britton 2nd Floor Ave
- 11 Britton Ave
- 11 Britton Ave Unit 3
- 11 Britton Ave Unit 2
- 295 E Main St
- 345 E Main St
- 48 Brookside Ave
Ask me questions while you tour the home.