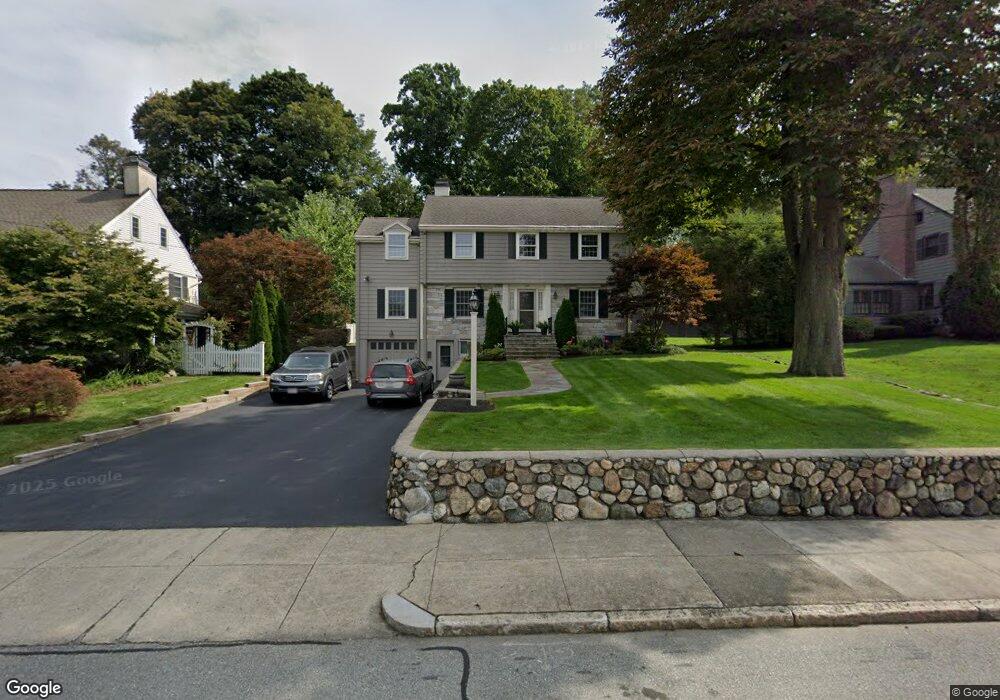
339 Main St Winchester, MA 01890
Estimated Value: $1,517,754 - $2,158,000
4
Beds
3
Baths
2,517
Sq Ft
$688/Sq Ft
Est. Value
About This Home
This home is located at 339 Main St, Winchester, MA 01890 and is currently estimated at $1,732,689, approximately $688 per square foot. 339 Main St is a home located in Middlesex County with nearby schools including Lincoln Elementary School, McCall Middle School, and Winchester High School.
Ownership History
Date
Name
Owned For
Owner Type
Purchase Details
Closed on
Jun 27, 2018
Sold by
Cammon Fred C and Cammon Carol J
Bought by
Cammon Ft
Current Estimated Value
Purchase Details
Closed on
Sep 17, 1991
Sold by
Bottafuoco Eleanor
Bought by
Cammon Fred C and Carol J Cammon
Create a Home Valuation Report for This Property
The Home Valuation Report is an in-depth analysis detailing your home's value as well as a comparison with similar homes in the area
Purchase History
| Date | Buyer | Sale Price | Title Company |
|---|---|---|---|
| Cammon Ft | -- | -- | |
| Cammon Fred C | $290,000 | -- |
Source: Public Records
Mortgage History
| Date | Status | Borrower | Loan Amount |
|---|---|---|---|
| Previous Owner | Cammon Fred C | $295,000 | |
| Previous Owner | Cammon Fred C | $150,000 |
Source: Public Records
Tax History
| Year | Tax Paid | Tax Assessment Tax Assessment Total Assessment is a certain percentage of the fair market value that is determined by local assessors to be the total taxable value of land and additions on the property. | Land | Improvement |
|---|---|---|---|---|
| 2025 | $153 | $1,377,100 | $813,100 | $564,000 |
| 2024 | $15,163 | $1,338,300 | $813,100 | $525,200 |
| 2023 | $14,400 | $1,220,300 | $715,500 | $504,800 |
| 2022 | $14,140 | $1,130,300 | $650,500 | $479,800 |
| 2021 | $13,040 | $1,016,400 | $536,600 | $479,800 |
| 2020 | $12,593 | $1,016,400 | $536,600 | $479,800 |
| 2019 | $11,197 | $924,600 | $444,800 | $479,800 |
| 2018 | $11,118 | $912,100 | $444,800 | $467,300 |
| 2017 | $10,394 | $846,400 | $404,100 | $442,300 |
| 2016 | $9,107 | $779,700 | $349,600 | $430,100 |
| 2015 | $9,283 | $764,700 | $349,600 | $415,100 |
| 2014 | $8,647 | $683,000 | $280,500 | $402,500 |
Source: Public Records
Map
Nearby Homes
- 4 Leslie Rd
- 45 Bacon St
- 17 Cranston Rd
- 9 Lakeview Terrace
- 6 Marchant Rd
- 263 Highland Ave
- 115 Washington St Unit 2A
- 39 Town Way
- 19 Town Way
- 1 Town Way
- 2 Priscilla Ln
- 53 Winford Way
- 2 Canterbury Rd
- 20 Grove Place
- 61 Grove St
- 35 Hollywood Rd
- 666 Main St Unit 315
- 27 Everett Ave
- 13 Nelson St
- 10 Sheffield W
Your Personal Tour Guide
Ask me questions while you tour the home.