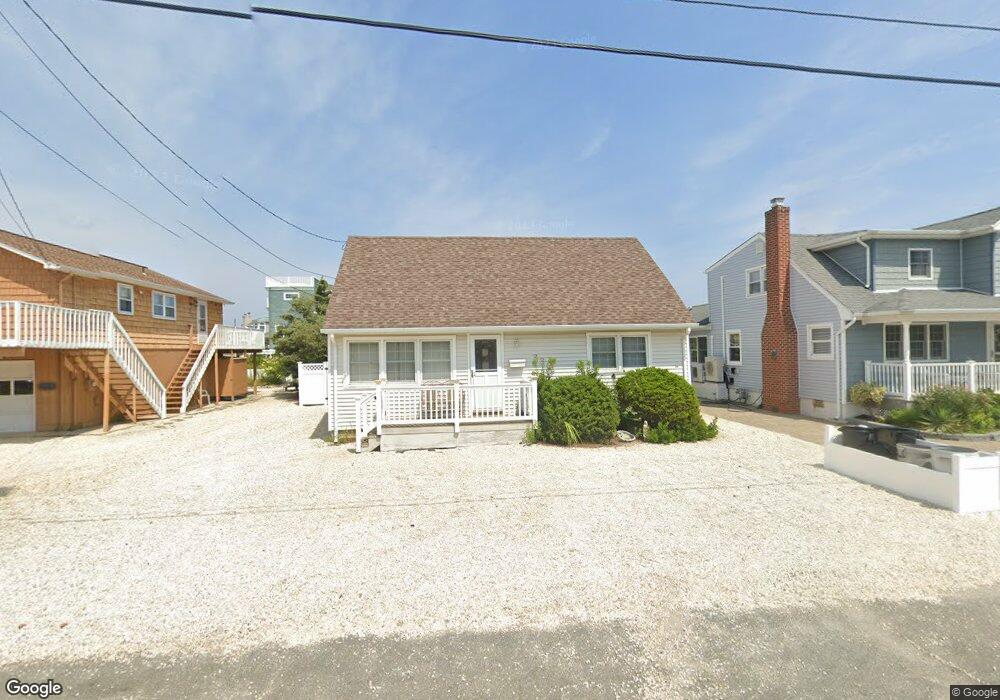
339 N 10th St Surf City, NJ 08008
Long Beach Island NeighborhoodEstimated Value: $1,125,000 - $1,270,000
4
Beds
2
Baths
1,152
Sq Ft
$1,050/Sq Ft
Est. Value
About This Home
This home is located at 339 N 10th St, Surf City, NJ 08008 and is currently estimated at $1,209,924, approximately $1,050 per square foot. 339 N 10th St is a home located in Ocean County with nearby schools including Ethel A. Jacobsen Elementary School, Long Beach Island Grade School, and Southern Regional Middle School.
Ownership History
Date
Name
Owned For
Owner Type
Purchase Details
Closed on
Sep 25, 1998
Sold by
Massimino Joseph F and Massimino Joyce H
Bought by
Campbell William and Campbell Donna
Current Estimated Value
Home Financials for this Owner
Home Financials are based on the most recent Mortgage that was taken out on this home.
Original Mortgage
$30,000
Interest Rate
6.89%
Create a Home Valuation Report for This Property
The Home Valuation Report is an in-depth analysis detailing your home's value as well as a comparison with similar homes in the area
Home Values in the Area
Average Home Value in this Area
Purchase History
| Date | Buyer | Sale Price | Title Company |
|---|---|---|---|
| Campbell William | $157,000 | -- |
Source: Public Records
Mortgage History
| Date | Status | Borrower | Loan Amount |
|---|---|---|---|
| Closed | Campbell William | $30,000 |
Source: Public Records
Tax History Compared to Growth
Tax History
| Year | Tax Paid | Tax Assessment Tax Assessment Total Assessment is a certain percentage of the fair market value that is determined by local assessors to be the total taxable value of land and additions on the property. | Land | Improvement |
|---|---|---|---|---|
| 2025 | $6,675 | $640,000 | $460,000 | $180,000 |
| 2024 | $6,432 | $640,000 | $460,000 | $180,000 |
| 2023 | $6,272 | $640,000 | $460,000 | $180,000 |
| 2022 | $6,272 | $640,000 | $460,000 | $180,000 |
| 2021 | $5,773 | $640,000 | $460,000 | $180,000 |
| 2020 | $5,587 | $640,000 | $460,000 | $180,000 |
| 2019 | $5,574 | $640,000 | $460,000 | $180,000 |
| 2018 | $5,174 | $509,800 | $378,000 | $131,800 |
| 2017 | $5,241 | $509,800 | $378,000 | $131,800 |
| 2016 | $5,113 | $509,800 | $378,000 | $131,800 |
| 2015 | $4,904 | $509,800 | $378,000 | $131,800 |
| 2014 | $4,879 | $509,800 | $378,000 | $131,800 |
Source: Public Records
Map
Nearby Homes