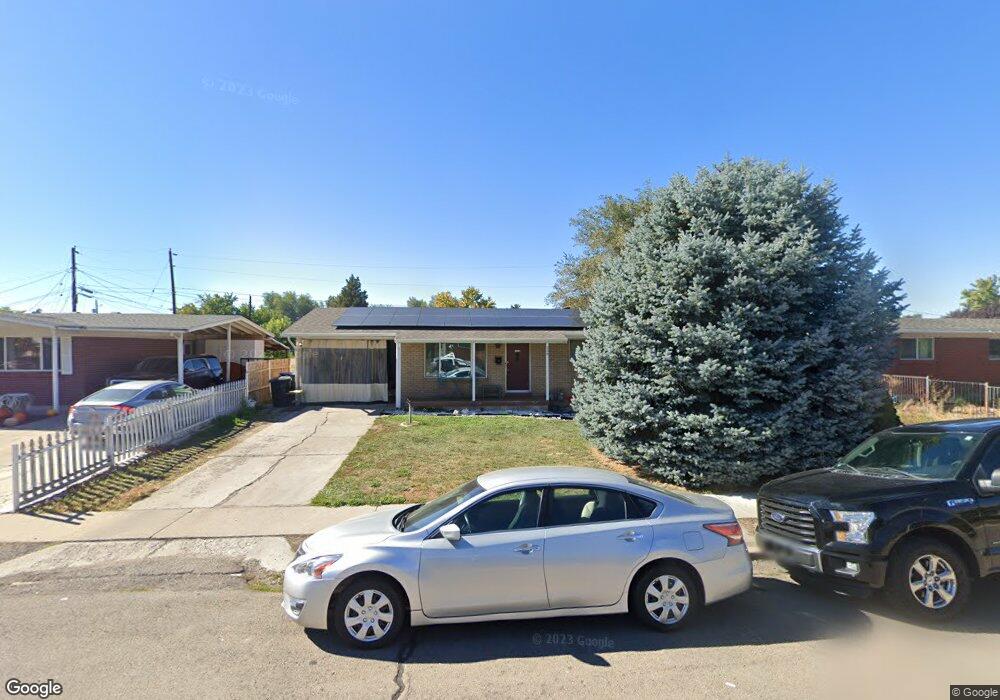
339 N 1120 W Provo, UT 84601
Rivergrove NeighborhoodEstimated Value: $450,000 - $476,000
3
Beds
2
Baths
2,274
Sq Ft
$204/Sq Ft
Est. Value
About This Home
This home is located at 339 N 1120 W, Provo, UT 84601 and is currently estimated at $463,119, approximately $203 per square foot. 339 N 1120 W is a home located in Utah County with nearby schools including Timpanogos Elementary School, Dixon Middle School, and Provo High School.
Ownership History
Date
Name
Owned For
Owner Type
Purchase Details
Closed on
Dec 6, 2021
Sold by
Pachev and Sarah
Bought by
Ochoa Yolisma and Soto Ma Zaragoza
Current Estimated Value
Home Financials for this Owner
Home Financials are based on the most recent Mortgage that was taken out on this home.
Original Mortgage
$392,755
Outstanding Balance
$361,135
Interest Rate
3.09%
Mortgage Type
FHA
Estimated Equity
$101,984
Purchase Details
Closed on
Nov 30, 2006
Sold by
Christensen Georgia R
Bought by
Pachev Alexander and Pachev Sarah
Home Financials for this Owner
Home Financials are based on the most recent Mortgage that was taken out on this home.
Original Mortgage
$20,000
Interest Rate
6.37%
Mortgage Type
Purchase Money Mortgage
Purchase Details
Closed on
Apr 3, 2000
Sold by
Christensen Georgia R and Christensen Richard L
Bought by
Christensen Georgia R
Create a Home Valuation Report for This Property
The Home Valuation Report is an in-depth analysis detailing your home's value as well as a comparison with similar homes in the area
Home Values in the Area
Average Home Value in this Area
Purchase History
| Date | Buyer | Sale Price | Title Company |
|---|---|---|---|
| Ochoa Yolisma | -- | Old Republic Title | |
| Pachev Alexander | -- | Horizon Title Insurance | |
| Christensen Georgia R | -- | Mountain West Title Company |
Source: Public Records
Mortgage History
| Date | Status | Borrower | Loan Amount |
|---|---|---|---|
| Open | Ochoa Yolisma | $392,755 | |
| Previous Owner | Pachev Alexander | $20,000 |
Source: Public Records
Tax History Compared to Growth
Tax History
| Year | Tax Paid | Tax Assessment Tax Assessment Total Assessment is a certain percentage of the fair market value that is determined by local assessors to be the total taxable value of land and additions on the property. | Land | Improvement |
|---|---|---|---|---|
| 2025 | $2,076 | $216,095 | $144,800 | $248,100 |
| 2024 | $2,076 | $204,380 | $0 | $0 |
| 2023 | $2,121 | $205,810 | $0 | $0 |
| 2022 | $2,233 | $218,515 | $0 | $0 |
| 2021 | $1,712 | $292,100 | $91,900 | $200,200 |
| 2020 | $1,660 | $265,500 | $83,500 | $182,000 |
| 2019 | $1,587 | $264,000 | $83,500 | $180,500 |
| 2018 | $1,410 | $238,000 | $80,200 | $157,800 |
| 2017 | $1,250 | $115,885 | $0 | $0 |
| 2016 | $1,193 | $103,125 | $0 | $0 |
| 2015 | $1,126 | $98,340 | $0 | $0 |
| 2014 | $1,060 | $96,525 | $0 | $0 |
Source: Public Records
Map
Nearby Homes