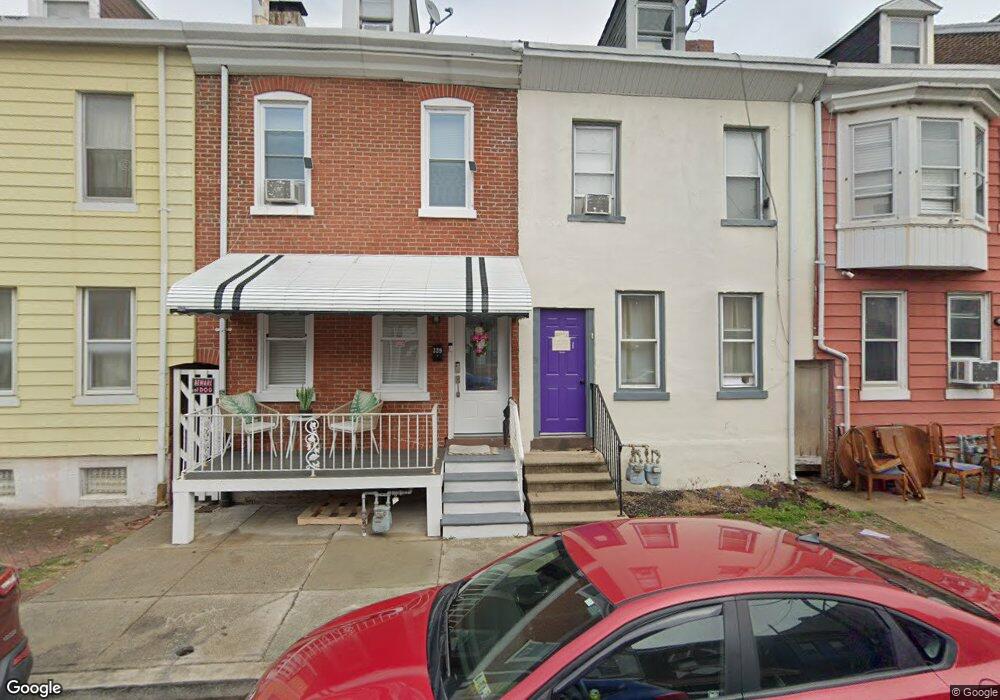
339 N 11th St Reading, PA 19604
Hillside NeighborhoodEstimated Value: $129,000 - $174,000
4
Beds
1
Bath
1,518
Sq Ft
$100/Sq Ft
Est. Value
About This Home
This home is located at 339 N 11th St, Reading, PA 19604 and is currently estimated at $152,320, approximately $100 per square foot. 339 N 11th St is a home located in Berks County with nearby schools including Tenth & Penn El School, Central Middle School, and Reading Senior High School.
Ownership History
Date
Name
Owned For
Owner Type
Purchase Details
Closed on
Jul 6, 2021
Sold by
Caba Caba Eligio A Eligio A
Bought by
Caba Caba Joan M Joan M
Current Estimated Value
Home Financials for this Owner
Home Financials are based on the most recent Mortgage that was taken out on this home.
Original Mortgage
$85,914
Outstanding Balance
$77,954
Interest Rate
2.9%
Mortgage Type
FHA
Estimated Equity
$74,366
Purchase Details
Closed on
Dec 21, 2009
Sold by
Willman Ann Marie
Bought by
Caba Caba Eligio A
Home Financials for this Owner
Home Financials are based on the most recent Mortgage that was taken out on this home.
Original Mortgage
$16,117
Interest Rate
4.3%
Mortgage Type
Unknown
Purchase Details
Closed on
Sep 9, 2005
Sold by
Willa Joseph R and Willa Suzann
Bought by
Willman Ann Marie
Create a Home Valuation Report for This Property
The Home Valuation Report is an in-depth analysis detailing your home's value as well as a comparison with similar homes in the area
Home Values in the Area
Average Home Value in this Area
Purchase History
| Date | Buyer | Sale Price | Title Company |
|---|---|---|---|
| Caba Caba Joan M Joan M | $87,500 | Edge Abstract | |
| Caba Caba Eligio A | $62,500 | None Available | |
| Willman Ann Marie | $32,000 | -- |
Source: Public Records
Mortgage History
| Date | Status | Borrower | Loan Amount |
|---|---|---|---|
| Open | Caba Caba Joan M Joan M | $85,914 | |
| Previous Owner | Caba Caba Eligio A | $16,117 | |
| Previous Owner | Caba Caba Eligio A | $50,000 |
Source: Public Records
Tax History
| Year | Tax Paid | Tax Assessment Tax Assessment Total Assessment is a certain percentage of the fair market value that is determined by local assessors to be the total taxable value of land and additions on the property. | Land | Improvement |
|---|---|---|---|---|
| 2025 | $874 | $32,200 | $13,000 | $19,200 |
| 2024 | $1,430 | $32,200 | $13,000 | $19,200 |
| 2023 | $1,408 | $32,200 | $13,000 | $19,200 |
| 2022 | $1,408 | $32,200 | $13,000 | $19,200 |
| 2021 | $1,408 | $32,200 | $13,000 | $19,200 |
| 2020 | $1,394 | $32,200 | $13,000 | $19,200 |
| 2019 | $1,394 | $32,200 | $13,000 | $19,200 |
| 2018 | $1,394 | $32,200 | $13,000 | $19,200 |
| 2017 | $1,384 | $32,200 | $13,000 | $19,200 |
| 2016 | $791 | $32,200 | $13,000 | $19,200 |
| 2015 | $791 | $32,200 | $13,000 | $19,200 |
| 2014 | $728 | $32,200 | $13,000 | $19,200 |
Source: Public Records
Map
Nearby Homes
Your Personal Tour Guide
Ask me questions while you tour the home.