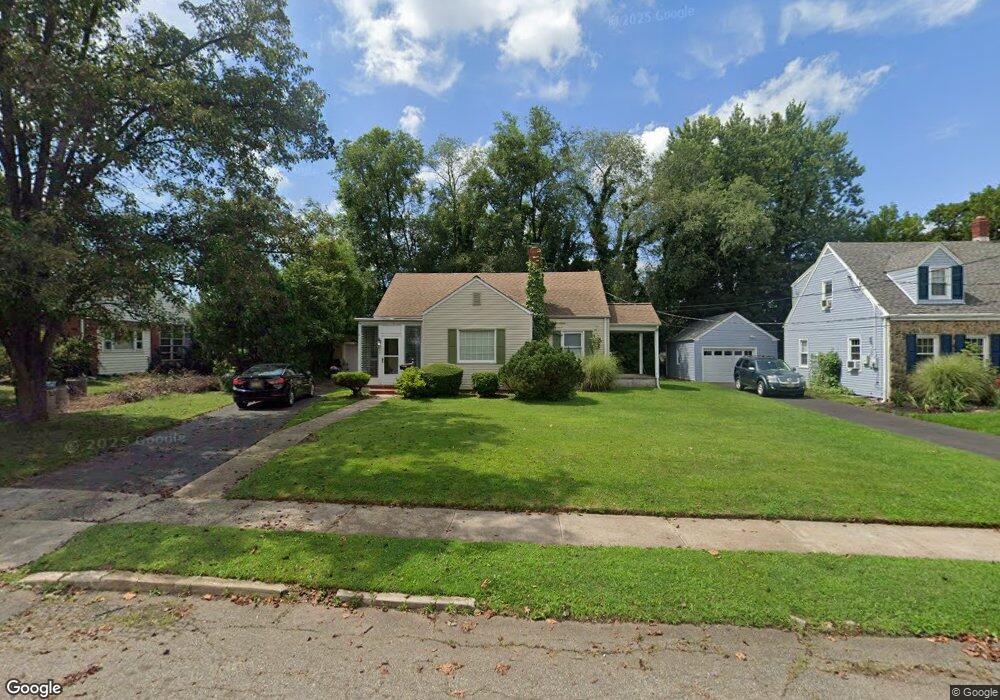
339 N 9th Ave Manville, NJ 08835
Estimated Value: $437,656 - $498,000
--
Bed
--
Bath
1,608
Sq Ft
$293/Sq Ft
Est. Value
About This Home
This home is located at 339 N 9th Ave, Manville, NJ 08835 and is currently estimated at $471,414, approximately $293 per square foot. 339 N 9th Ave is a home located in Somerset County with nearby schools including Weston Elementary School, Roosevelt School, and Alexander Batcho Intermediate School (ABIS).
Ownership History
Date
Name
Owned For
Owner Type
Purchase Details
Closed on
Jul 6, 1998
Sold by
Trimble Gary
Bought by
Snell Larry and Snell Stacy
Current Estimated Value
Home Financials for this Owner
Home Financials are based on the most recent Mortgage that was taken out on this home.
Original Mortgage
$118,000
Outstanding Balance
$24,127
Interest Rate
6.99%
Estimated Equity
$447,287
Purchase Details
Closed on
Jan 10, 1992
Sold by
Ceiswich John and Ceiswich Cathy
Bought by
Trimble Gary S and Trimble Joan M
Purchase Details
Closed on
Dec 5, 1990
Sold by
Homyak Thomas Executor
Bought by
Ceiswich John M and Ceiswich Cathy
Create a Home Valuation Report for This Property
The Home Valuation Report is an in-depth analysis detailing your home's value as well as a comparison with similar homes in the area
Home Values in the Area
Average Home Value in this Area
Purchase History
| Date | Buyer | Sale Price | Title Company |
|---|---|---|---|
| Snell Larry | $124,000 | -- | |
| Trimble Gary S | $107,500 | -- | |
| Ceiswich John M | -- | -- |
Source: Public Records
Mortgage History
| Date | Status | Borrower | Loan Amount |
|---|---|---|---|
| Open | Snell Larry | $118,000 |
Source: Public Records
Tax History Compared to Growth
Tax History
| Year | Tax Paid | Tax Assessment Tax Assessment Total Assessment is a certain percentage of the fair market value that is determined by local assessors to be the total taxable value of land and additions on the property. | Land | Improvement |
|---|---|---|---|---|
| 2025 | $8,074 | $389,000 | $213,300 | $175,700 |
| 2024 | $8,074 | $358,700 | $186,300 | $172,400 |
| 2023 | $7,940 | $330,300 | $168,300 | $162,000 |
| 2022 | $6,613 | $252,800 | $141,300 | $111,500 |
| 2021 | $8,617 | $291,400 | $120,700 | $170,700 |
| 2020 | $8,565 | $272,000 | $106,400 | $165,600 |
| 2019 | $8,435 | $258,200 | $106,400 | $151,800 |
| 2018 | $7,753 | $237,100 | $92,200 | $144,900 |
| 2017 | $7,540 | $234,600 | $87,400 | $147,200 |
| 2016 | $7,268 | $234,600 | $87,400 | $147,200 |
| 2015 | $8,005 | $331,200 | $165,300 | $165,900 |
| 2014 | $7,846 | $331,200 | $165,300 | $165,900 |
Source: Public Records
Map
Nearby Homes