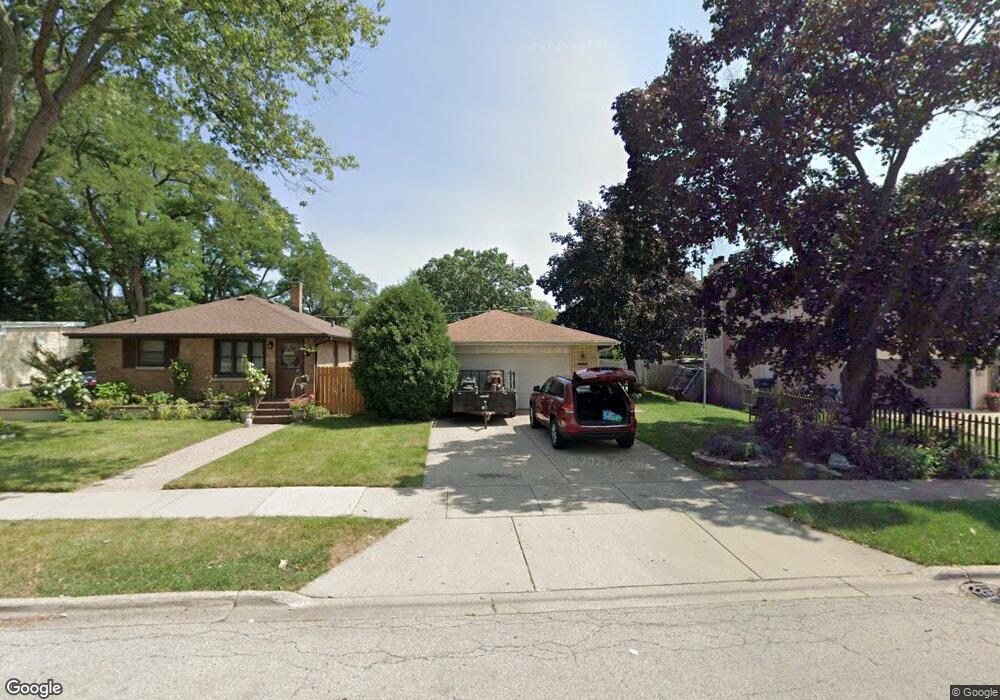
339 N Berwick Blvd Waukegan, IL 60085
West Waukegan NeighborhoodEstimated Value: $256,000 - $259,000
2
Beds
2
Baths
1,292
Sq Ft
$199/Sq Ft
Est. Value
About This Home
This home is located at 339 N Berwick Blvd, Waukegan, IL 60085 and is currently estimated at $257,244, approximately $199 per square foot. 339 N Berwick Blvd is a home located in Lake County with nearby schools including Whittier Elementary School, Robert E. Abbott Middle School, and Waukegan High School.
Ownership History
Date
Name
Owned For
Owner Type
Purchase Details
Closed on
Aug 24, 2001
Sold by
Marks David A and Peralta Felix
Bought by
Martinez Romaldo Ruiz and Ruiz Margarita
Current Estimated Value
Home Financials for this Owner
Home Financials are based on the most recent Mortgage that was taken out on this home.
Original Mortgage
$149,150
Outstanding Balance
$58,013
Interest Rate
7.11%
Estimated Equity
$199,231
Purchase Details
Closed on
Aug 26, 1999
Sold by
Onan Jerome H and The Jerome H Onan Living Trust
Bought by
Marks David A and Peralta Felix
Home Financials for this Owner
Home Financials are based on the most recent Mortgage that was taken out on this home.
Original Mortgage
$130,424
Interest Rate
7.77%
Mortgage Type
FHA
Purchase Details
Closed on
Jan 25, 1999
Sold by
Onan Jerome H and Ashen C Onan Trust
Bought by
Onan Jerome H and Jerome H Onan Living Trust
Create a Home Valuation Report for This Property
The Home Valuation Report is an in-depth analysis detailing your home's value as well as a comparison with similar homes in the area
Home Values in the Area
Average Home Value in this Area
Purchase History
| Date | Buyer | Sale Price | Title Company |
|---|---|---|---|
| Martinez Romaldo Ruiz | $157,000 | First American Title | |
| Marks David A | $131,500 | First American Title | |
| Onan Jerome H | -- | -- |
Source: Public Records
Mortgage History
| Date | Status | Borrower | Loan Amount |
|---|---|---|---|
| Open | Martinez Romaldo Ruiz | $149,150 | |
| Previous Owner | Marks David A | $130,424 |
Source: Public Records
Tax History Compared to Growth
Tax History
| Year | Tax Paid | Tax Assessment Tax Assessment Total Assessment is a certain percentage of the fair market value that is determined by local assessors to be the total taxable value of land and additions on the property. | Land | Improvement |
|---|---|---|---|---|
| 2024 | $5,427 | $73,217 | $10,031 | $63,186 |
| 2023 | $5,251 | $65,552 | $8,981 | $56,571 |
| 2022 | $5,251 | $59,718 | $7,642 | $52,076 |
| 2021 | $5,104 | $54,955 | $7,068 | $47,887 |
| 2020 | $5,123 | $51,197 | $6,585 | $44,612 |
| 2019 | $5,104 | $46,914 | $6,034 | $40,880 |
| 2018 | $4,474 | $40,982 | $7,764 | $33,218 |
| 2017 | $4,304 | $36,258 | $6,869 | $29,389 |
| 2016 | $3,942 | $31,507 | $5,969 | $25,538 |
| 2015 | $3,750 | $28,199 | $5,342 | $22,857 |
| 2014 | $3,505 | $26,257 | $6,069 | $20,188 |
| 2012 | $4,564 | $28,448 | $6,576 | $21,872 |
Source: Public Records
Map
Nearby Homes
- 2115 Lydia St
- 615 Tiffany Dr
- 0 Brookside Ave
- 1213 Grand Ave
- 132 Dorchester Ct
- 49 S Lewis Ave
- 24 Washington Terrace
- 1416 Hamilton Ct
- 1521 Catalpa Ave
- 102 Baldwin Ave
- 1005 N Lewis Ave
- 824 N Butrick St
- 968 Judge Ave
- 1023 N Elmwood Ave
- 23 N Jackson St
- 1038 Indiana Ave
- 1109 Massena Ave
- 12601 W Atlantic Ave
- 2116 & 2101 Williamsburg Dr
- 1000 Pine St
- 343 N Berwick Blvd
- 335 N Berwick Blvd
- 405 N Berwick Blvd
- 338 N Martin Ave
- 332 N Martin Luther Ave
- 342 N Martin Ave
- 2106 Brookside Ave
- 334 N Martin Ave
- 404 N Martin Ave
- 2024 Brookside Ave
- 411 N Berwick Blvd
- 336 N Berwick Blvd
- 340 N Berwick Blvd
- 332 N Berwick Blvd
- 400 N Berwick Blvd
- 412 N Martin Ave
- 2110 Brookside Ave
- 2107 Hyde Park Ave
- 414 N Berwick Blvd
- 420 N Martin Ave