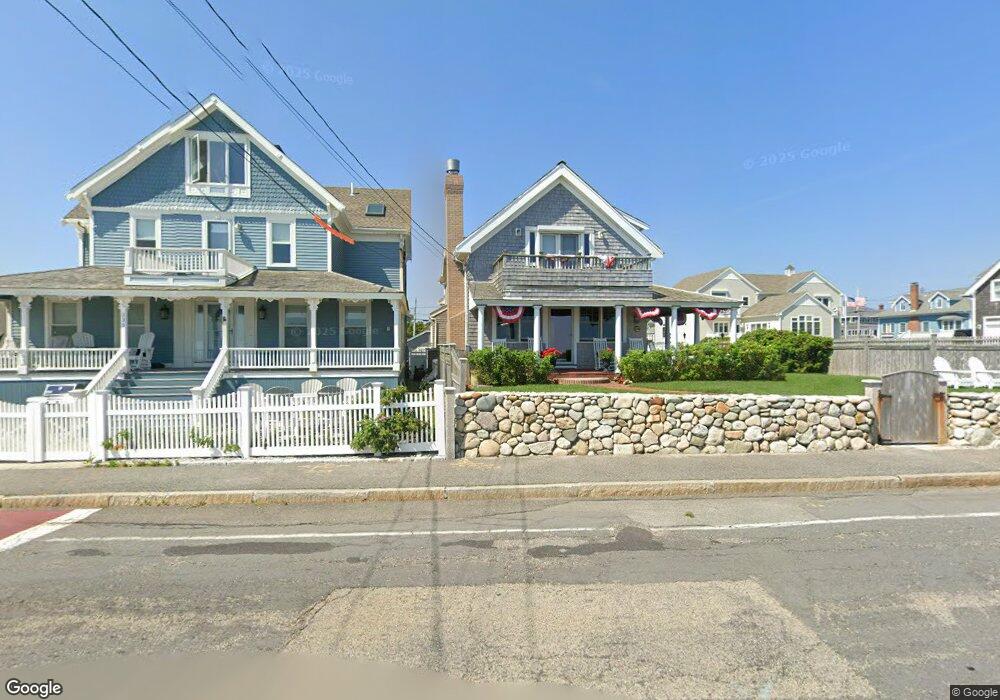
339 Ocean St Marshfield, MA 02050
Ocean Bluff-Brant Rock NeighborhoodEstimated Value: $1,097,000 - $1,392,000
3
Beds
3
Baths
2,147
Sq Ft
$574/Sq Ft
Est. Value
About This Home
This home is located at 339 Ocean St, Marshfield, MA 02050 and is currently estimated at $1,232,623, approximately $574 per square foot. 339 Ocean St is a home with nearby schools including Governor Edward Winslow School, Furnace Brook Middle School, and Marshfield High School.
Ownership History
Date
Name
Owned For
Owner Type
Purchase Details
Closed on
Jun 6, 2023
Sold by
Read Ronald W and Finneran Joan C
Bought by
Ronald W Read Ret and Read
Current Estimated Value
Create a Home Valuation Report for This Property
The Home Valuation Report is an in-depth analysis detailing your home's value as well as a comparison with similar homes in the area
Home Values in the Area
Average Home Value in this Area
Purchase History
| Date | Buyer | Sale Price | Title Company |
|---|---|---|---|
| Ronald W Read Ret | -- | None Available | |
| Ronald W Read Ret | -- | None Available |
Source: Public Records
Tax History
| Year | Tax Paid | Tax Assessment Tax Assessment Total Assessment is a certain percentage of the fair market value that is determined by local assessors to be the total taxable value of land and additions on the property. | Land | Improvement |
|---|---|---|---|---|
| 2025 | $11,808 | $1,192,700 | $624,100 | $568,600 |
| 2024 | $10,911 | $1,050,100 | $549,800 | $500,300 |
| 2023 | $10,131 | $895,000 | $475,500 | $419,500 |
| 2022 | $8,917 | $688,600 | $349,200 | $339,400 |
| 2021 | $8,882 | $673,400 | $349,200 | $324,200 |
| 2020 | $8,478 | $636,000 | $326,900 | $309,100 |
| 2019 | $8,306 | $620,800 | $326,900 | $293,900 |
| 2018 | $8,300 | $620,800 | $326,900 | $293,900 |
| 2017 | $8,242 | $600,700 | $326,900 | $273,800 |
| 2016 | $8,170 | $588,600 | $326,900 | $261,700 |
| 2015 | $8,733 | $657,100 | $386,400 | $270,700 |
| 2014 | $8,480 | $638,100 | $386,400 | $251,700 |
Source: Public Records
Map
Nearby Homes
- 17 Dyke Rd
- 78 Tower Ave
- 116 Island St
- 122 June St
- 106 Careswell St
- 85 Constitution Rd
- 71 Gurnet Rd
- 32 Gratto Rd
- 116 Outlook Rd
- 30 Chandler Dr
- 155 Quincy Ave
- 42 Carr Rd
- 86 Barouche Dr
- 7 Pierce Rd
- 92 Salt Meadow Waye
- 184 King Phillips Pathe
- 290 S River St
- 1192 S River St
- 255 Ridge Rd
- 242 Enterprise St
- 335 Ocean St
- 335 Ocean St
- 11 Hancock St
- 349 Ocean St
- 15 Hancock St
- 46 Ashburton Ave
- 328 Ocean St
- 8 Knox St
- 324 Ocean St
- 355 Ocean St
- 50 Ashburton Ave
- 27 Ashburton Ave
- 29 Ashburton Ave
- 322 Ocean St
- 39 Ashburton Ave
- 23 Ashburton Ave
- 45 Ashburton Ave
- 359 Ocean St
- 15 Liversidge St
- 15 Liversidge St Unit 1
Your Personal Tour Guide
Ask me questions while you tour the home.