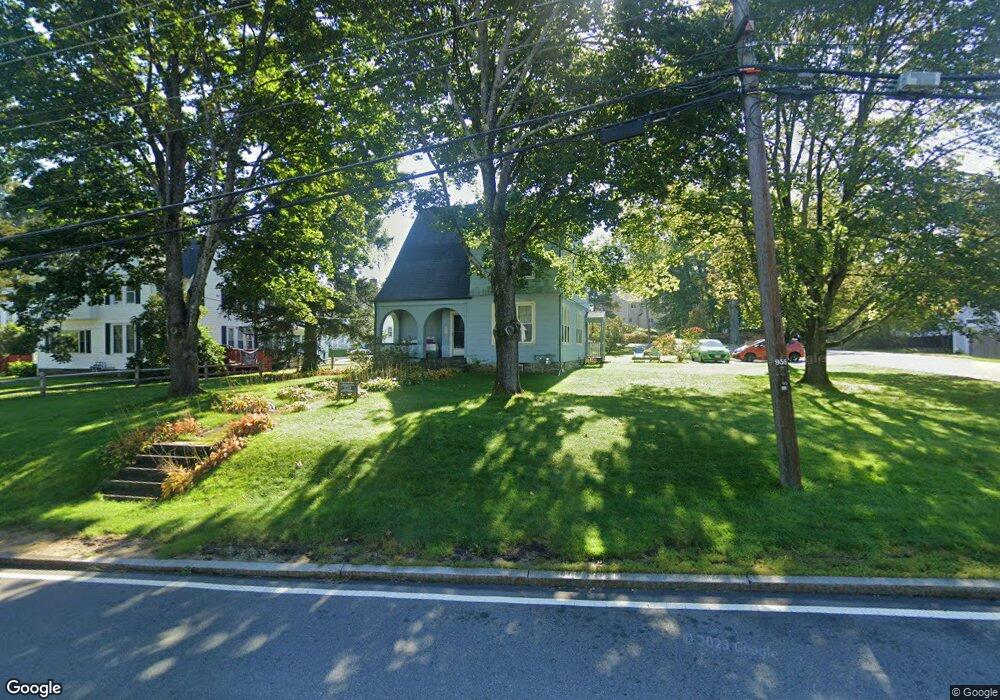
339 Osgood St North Andover, MA 01845
Estimated Value: $557,000 - $671,000
3
Beds
1
Bath
1,512
Sq Ft
$401/Sq Ft
Est. Value
About This Home
This home is located at 339 Osgood St, North Andover, MA 01845 and is currently estimated at $605,936, approximately $400 per square foot. 339 Osgood St is a home located in Essex County with nearby schools including Kittredge Elementary School, North Andover Middle School, and North Andover High School.
Ownership History
Date
Name
Owned For
Owner Type
Purchase Details
Closed on
Jan 9, 2004
Sold by
Mendel Joseph B and Mendel Theresa A
Bought by
Mendel Theresa A
Current Estimated Value
Purchase Details
Closed on
Nov 16, 1993
Sold by
Odonnell Brian F
Bought by
Mendel Joseph
Home Financials for this Owner
Home Financials are based on the most recent Mortgage that was taken out on this home.
Original Mortgage
$139,500
Interest Rate
6.79%
Mortgage Type
Purchase Money Mortgage
Create a Home Valuation Report for This Property
The Home Valuation Report is an in-depth analysis detailing your home's value as well as a comparison with similar homes in the area
Home Values in the Area
Average Home Value in this Area
Purchase History
| Date | Buyer | Sale Price | Title Company |
|---|---|---|---|
| Mendel Theresa A | -- | -- | |
| Mendel Joseph | $151,000 | -- |
Source: Public Records
Mortgage History
| Date | Status | Borrower | Loan Amount |
|---|---|---|---|
| Previous Owner | Mendel Joseph | $138,900 | |
| Previous Owner | Mendel Joseph | $139,500 |
Source: Public Records
Tax History Compared to Growth
Tax History
| Year | Tax Paid | Tax Assessment Tax Assessment Total Assessment is a certain percentage of the fair market value that is determined by local assessors to be the total taxable value of land and additions on the property. | Land | Improvement |
|---|---|---|---|---|
| 2025 | $5,716 | $507,600 | $302,500 | $205,100 |
| 2024 | $5,363 | $483,600 | $284,700 | $198,900 |
| 2023 | $5,289 | $432,100 | $261,600 | $170,500 |
| 2022 | $5,229 | $386,500 | $234,900 | $151,600 |
| 2021 | $4,996 | $352,600 | $213,500 | $139,100 |
| 2020 | $4,845 | $352,600 | $213,500 | $139,100 |
| 2019 | $4,816 | $359,100 | $213,500 | $145,600 |
| 2018 | $5,218 | $359,100 | $213,500 | $145,600 |
| 2017 | $4,557 | $319,100 | $177,500 | $141,600 |
| 2016 | $4,556 | $319,300 | $174,100 | $145,200 |
| 2015 | $4,183 | $290,700 | $168,100 | $122,600 |
Source: Public Records
Map
Nearby Homes
- 16 Court St
- 98 Mill Pond
- 112 Mill Pond
- 115 Mill Pond
- 116 Mill Pond
- 11 W Bradstreet Rd
- 19 Fernview Ave Unit 6
- 19 Fernview Ave Unit 5
- 12 Walker Rd Unit 6
- 25 Fernview Ave Unit 8
- 23 Fernview Ave Unit 1
- 35 Fernview Ave Unit 5
- 40 Fernview Ave Unit 11
- 52 Fernview Ave Unit 7
- 168 Greene St
- 447 Stevens St
- 3 Great Pond Rd
- 387 Massachusetts Ave
- 90 Edgelawn Ave Unit 1
- 479 Stevens St
- 343 Osgood St
- 343 Osgood St Unit 343
- 345 Osgood St
- 345 Osgood St Unit 345
- 22 Phillips Ct Unit 24
- 329 Osgood St
- 348 Osgood St
- 351 Osgood St
- 336 Osgood St
- 350 Osgood St
- 288 Pleasant St
- 294 Pleasant St
- 15 Phillips Ct
- 321 Osgood St
- 334 Osgood St
- 26 Phillips Ct
- 355 Osgood St Unit 2
- 355 Osgood St
- 357 Osgood St
- 355 Osgood St Unit 355