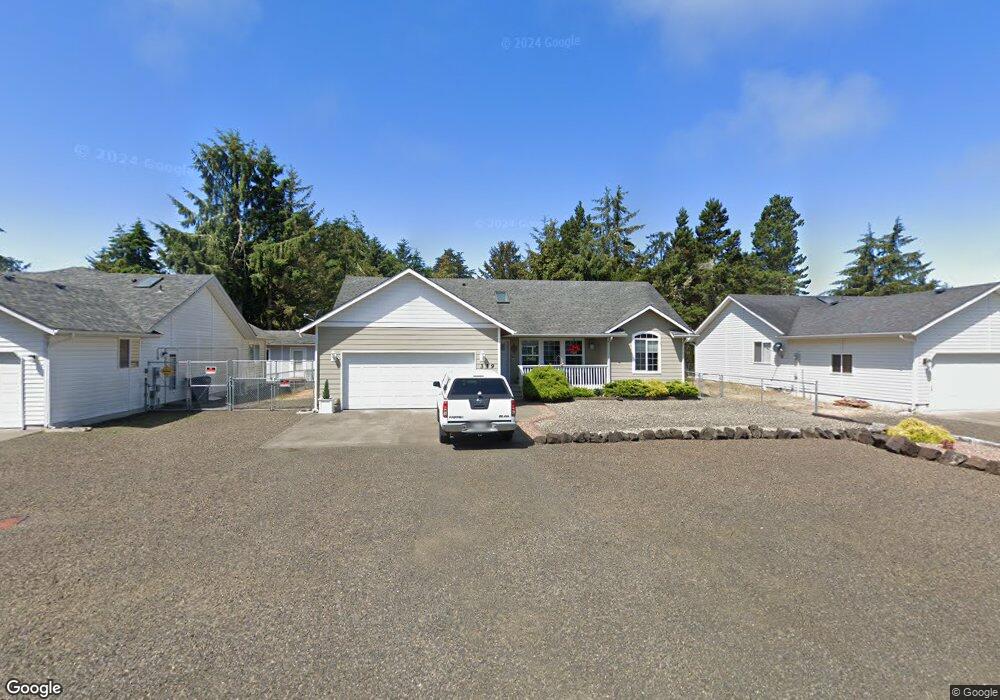
339 Ponderosa Loop NE Ocean Shores, WA 98569
Estimated Value: $373,000 - $468,000
3
Beds
2
Baths
1,337
Sq Ft
$310/Sq Ft
Est. Value
About This Home
This home is located at 339 Ponderosa Loop NE, Ocean Shores, WA 98569 and is currently estimated at $414,446, approximately $309 per square foot. 339 Ponderosa Loop NE is a home located in Grays Harbor County with nearby schools including North Beach Junior/Senior High School.
Ownership History
Date
Name
Owned For
Owner Type
Purchase Details
Closed on
Jul 11, 2011
Sold by
Ramey James P and Ramey Roger B
Bought by
Cor Charles R and Cor Cheryl L
Current Estimated Value
Purchase Details
Closed on
Jun 20, 2011
Sold by
Johnson Judy F and Johnson Darrel D
Bought by
Ramey James P and Ramey Roger B
Purchase Details
Closed on
Mar 20, 2008
Sold by
Dunn Beverly A
Bought by
Johnson Darrel D and Johnson Judy F
Purchase Details
Closed on
Jun 23, 2006
Sold by
Brunk William and Brunk Cathie
Bought by
Dunn Beverly A
Purchase Details
Closed on
Oct 27, 2005
Sold by
Black Douglas
Bought by
Brunk William and Brunk Cathie
Home Financials for this Owner
Home Financials are based on the most recent Mortgage that was taken out on this home.
Original Mortgage
$100,000
Interest Rate
5.68%
Mortgage Type
Purchase Money Mortgage
Create a Home Valuation Report for This Property
The Home Valuation Report is an in-depth analysis detailing your home's value as well as a comparison with similar homes in the area
Home Values in the Area
Average Home Value in this Area
Purchase History
| Date | Buyer | Sale Price | Title Company |
|---|---|---|---|
| Cor Charles R | $120,000 | Grays Harbor Title | |
| Ramey James P | $29,773 | None Available | |
| Johnson Darrel D | -- | None Available | |
| Dunn Beverly A | $198,000 | Grays Harbor Title | |
| Brunk William | $32,000 | Grays Harbor Title |
Source: Public Records
Mortgage History
| Date | Status | Borrower | Loan Amount |
|---|---|---|---|
| Previous Owner | Brunk William | $100,000 |
Source: Public Records
Tax History Compared to Growth
Tax History
| Year | Tax Paid | Tax Assessment Tax Assessment Total Assessment is a certain percentage of the fair market value that is determined by local assessors to be the total taxable value of land and additions on the property. | Land | Improvement |
|---|---|---|---|---|
| 2025 | $2,426 | $383,086 | $45,000 | $338,086 |
| 2023 | $2,450 | $347,763 | $75,000 | $272,763 |
| 2022 | $2,198 | $260,044 | $54,200 | $205,844 |
| 2021 | $2,409 | $260,044 | $54,200 | $205,844 |
| 2020 | $2,260 | $233,293 | $37,375 | $195,918 |
| 2019 | $2,024 | $210,608 | $32,500 | $178,108 |
| 2018 | $2,077 | $183,730 | $25,000 | $158,730 |
| 2017 | $1,991 | $178,253 | $25,000 | $153,253 |
| 2016 | $1,684 | $167,140 | $22,000 | $145,140 |
| 2014 | -- | $147,210 | $12,000 | $135,210 |
| 2013 | -- | $163,070 | $15,000 | $148,070 |
Source: Public Records
Map
Nearby Homes
- 441 Bass Ave NE
- 276 Bass Ave NE
- 247 Bass Ave NE
- 260 Dolphin Ave NE
- 308 Lakeview Loop NE
- 314 Lakeview Loop NE
- 337 Hyde Ct NE
- 430 Dolphin Ave NE
- 470 Lake West Loop NE
- 445 Bass Ave NE
- 212 Dolphin Ave NE
- 336 Hyde Ct NE
- 360 Lakeview Loop NE
- 433 Dolphin Ave NE
- 242 Duck Lake Dr NE
- 366 Lakeview Loop NE
- 341 Duck Lake Dr NE
- 359 Duck Lake Dr NE
- 394 Lakeview Loop NE
- 284 Duck Lake Dr NE
- 335 Ponderosa Loop NE
- 336 Bass Ave NE
- 342 Bass Ave NE
- 345 Ponderosa Loop NE
- 331 Ponderosa Loop NE
- 350 Bass Ave NE
- 336 Ponderosa Loop NE
- 340 Ponderosa Loop NE
- 347 Ponderosa Loop NE
- 327 Ponderosa Loop NE
- 334 Ponderosa Loop NE
- 356 Bass Ave NE
- 314 Bass Ave NE
- 346 Ponderosa Loop NE
- 330 Ponderosa Loop NE
- 351 Ponderosa Loop NE
- 323 Ponderosa Loop NE
- 328 Ponderosa Loop NE
- 362 Bass Ave NE
- 306 Bass Ave NE