339 Redondo Dr Oceanside, CA 92057
North Valley NeighborhoodEstimated Value: $775,000 - $794,071
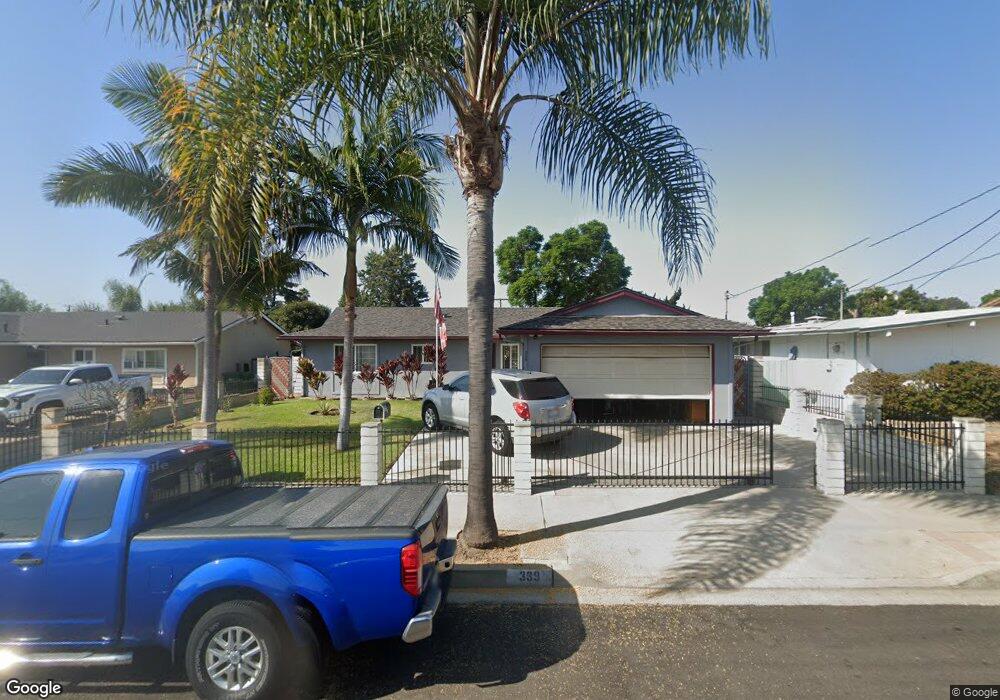
About This Home
This home is located at 339 Redondo Dr, Oceanside, CA 92057 and is currently estimated at $788,018, approximately $529 per square foot. 339 Redondo Dr is a home located in San Diego County with nearby schools including Libby Elementary School, Cesar Chavez Middle School, and El Camino High School.
Ownership History
We collect this data history from publicly available records. To have your information removed, we recommend requesting removal directly through your county’s website.
Purchase Details
Home Financials for this Owner
Home Financials are based on the most recent Mortgage that was taken out on this home.Purchase Details
Home Values in the Area
Average Home Value in this Area
Purchase History
We collect this data history from publicly available records. To have your information removed, we recommend requesting removal directly through your county’s website.
| Date | Buyer | Sale Price | Title Company |
|---|---|---|---|
| -- | Commonwealth Land Title Co | ||
| $133,000 | -- |
Mortgage History
We collect this data history from publicly available records. To have your information removed, we recommend requesting removal directly through your county’s website.
| Date | Status | Borrower | Loan Amount |
|---|---|---|---|
| Open | $315,507 | ||
| Closed | $63,750 | ||
| Closed | $340,000 | ||
| Closed | $352,000 | ||
| Closed | $20,000 | ||
| Closed | $126,000 | ||
| Closed | $123,000 | ||
| Closed | $25,250 |
Tax History
We collect this data history from publicly available records. To have your information removed, we recommend requesting removal directly through your county’s website.
| Year | Tax Paid | Tax Assessment Tax Assessment Total Assessment is a certain percentage of the fair market value that is determined by local assessors to be the total taxable value of land and additions on the property. | Land | Improvement |
|---|---|---|---|---|
| 2025 | $1,406 | $296,454 | $128,766 | $167,688 |
| 2024 | $1,403 | $290,642 | $126,242 | $164,400 |
| 2023 | $1,419 | $284,944 | $123,767 | $161,177 |
| 2022 | $1,485 | $279,358 | $121,341 | $158,017 |
| 2021 | $1,485 | $273,881 | $118,962 | $154,919 |
| 2020 | $1,471 | $271,074 | $117,743 | $153,331 |
| 2019 | $1,441 | $265,760 | $115,435 | $150,325 |
| 2018 | $2,869 | $260,550 | $113,172 | $147,378 |
| 2017 | $2,815 | $255,442 | $110,953 | $144,489 |
| 2016 | $2,722 | $250,434 | $108,778 | $141,656 |
| 2015 | $2,642 | $246,674 | $107,145 | $139,529 |
| 2014 | $2,540 | $241,843 | $105,047 | $136,796 |
Map
- 4808 Siesta Place
- 4914 Verde Dr
- 395 Calle Mariposa
- 4750 Calle Estrella
- 525 Calle Montecito Unit 122
- 510 Calle Montecito Unit 53
- 502 Calle Montecito Unit 18
- 5082 Cascade Way Unit 102
- 5069 Cascade Way Unit 101
- 262 Lustrosos St
- 260 Lustrosos St
- 309 Calle Montecito
- 289 Lustrosos St
- 4873 Merida Way
- 0 N River Rd Unit NDP2603842
- 4660 N River Rd Unit 150
- 5021 Los Morros Way Unit 31
- 4893 Merida Way
- 4658 Calle Del Palo
- 216 Ocotillo Place
Ask me questions while you tour the home.