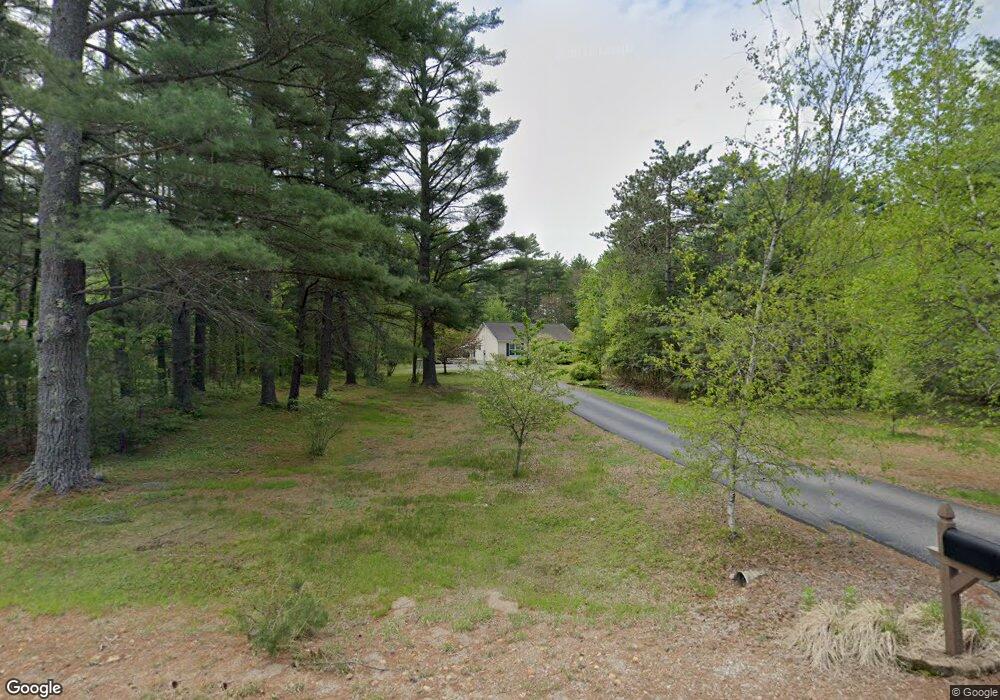
339 Ridlon Rd Berwick, ME 03901
Estimated Value: $425,157 - $446,000
3
Beds
2
Baths
1,176
Sq Ft
$366/Sq Ft
Est. Value
About This Home
This home is located at 339 Ridlon Rd, Berwick, ME 03901 and is currently estimated at $430,789, approximately $366 per square foot. 339 Ridlon Rd is a home located in York County with nearby schools including Noble High School.
Ownership History
Date
Name
Owned For
Owner Type
Purchase Details
Closed on
Jul 2, 2010
Sold by
Volinsky Lynn M and Volinsky Michael S
Bought by
Volinsky Lynn M
Current Estimated Value
Purchase Details
Closed on
Apr 24, 2009
Sold by
Volinsky Lynn M
Bought by
Volinsky Lynn M and Volinsky Michael
Purchase Details
Closed on
Mar 29, 2005
Sold by
Volinsky Lyon M and Volinsky Michael S
Bought by
Volinsky Lynn M
Create a Home Valuation Report for This Property
The Home Valuation Report is an in-depth analysis detailing your home's value as well as a comparison with similar homes in the area
Home Values in the Area
Average Home Value in this Area
Purchase History
| Date | Buyer | Sale Price | Title Company |
|---|---|---|---|
| Volinsky Lynn M | -- | -- | |
| Volinsky Lynn M | -- | -- | |
| Volinsky Lynn M | -- | -- |
Source: Public Records
Mortgage History
| Date | Status | Borrower | Loan Amount |
|---|---|---|---|
| Previous Owner | Volinsky Lynn M | $51,500 | |
| Previous Owner | Volinsky Lynn M | $15,000 |
Source: Public Records
Tax History Compared to Growth
Tax History
| Year | Tax Paid | Tax Assessment Tax Assessment Total Assessment is a certain percentage of the fair market value that is determined by local assessors to be the total taxable value of land and additions on the property. | Land | Improvement |
|---|---|---|---|---|
| 2024 | $4,317 | $346,200 | $110,500 | $235,700 |
| 2023 | $3,880 | $211,800 | $78,600 | $133,200 |
| 2022 | $3,859 | $211,800 | $78,600 | $133,200 |
| 2021 | $3,790 | $207,100 | $78,600 | $128,500 |
| 2020 | $4,009 | $207,100 | $78,600 | $128,500 |
| 2019 | $3,630 | $207,100 | $78,600 | $128,500 |
| 2018 | $3,560 | $202,300 | $74,900 | $127,400 |
| 2017 | $3,469 | $202,300 | $74,900 | $127,400 |
| 2016 | $3,271 | $200,700 | $74,900 | $125,800 |
| 2014 | $3,191 | $200,700 | $74,900 | $125,800 |
| 2013 | $3,221 | $200,700 | $74,900 | $125,800 |
Source: Public Records
Map
Nearby Homes
- 0 Old Ledge Rd
- 27 Murray Dr
- 20 Watercress Dr
- 73 Diamondback Dr
- 72 Diamondback Dr
- 75 Diamondback Dr
- 10 Erin Ln
- 17 Blue Rose Ln
- 9 Blue Rose Ln
- 10 York Ct
- 33-10G Lakota Rd
- 21 Johnny Ln
- 32 Mill St
- 128 Long Swamp Rd
- 2 Cleo Cir
- 33 Cleo Cir
- 64 Goldrush Ln
- TBD Long Swamp Rd
- 632 Salmon Falls Rd
- 27 Highland St