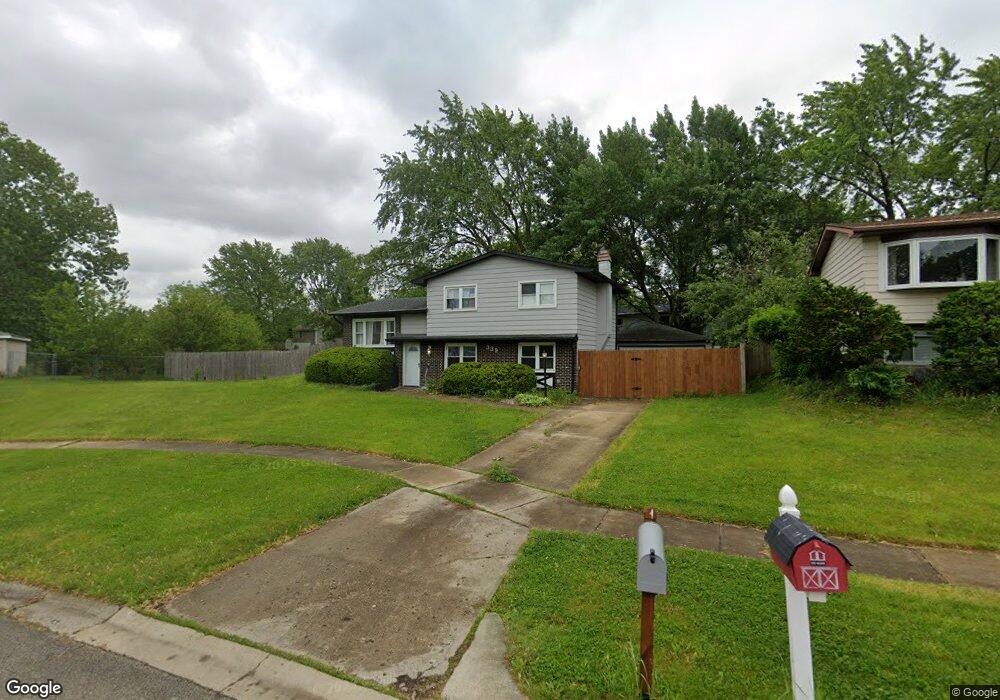
339 Ruth Cir Bolingbrook, IL 60440
East Bolingbrook NeighborhoodEstimated Value: $334,000 - $342,000
4
Beds
2
Baths
1,618
Sq Ft
$209/Sq Ft
Est. Value
About This Home
This home is located at 339 Ruth Cir, Bolingbrook, IL 60440 and is currently estimated at $338,444, approximately $209 per square foot. 339 Ruth Cir is a home located in Will County with nearby schools including Oak View Elementary School, Brooks Middle School, and Bolingbrook High School.
Ownership History
Date
Name
Owned For
Owner Type
Purchase Details
Closed on
Sep 5, 2017
Sold by
Lopatka Donna L Nitka and Kenneth F Nitka Declaration Of
Bought by
Virgil Jeffrey
Current Estimated Value
Home Financials for this Owner
Home Financials are based on the most recent Mortgage that was taken out on this home.
Original Mortgage
$175,900
Outstanding Balance
$147,125
Interest Rate
3.96%
Mortgage Type
New Conventional
Estimated Equity
$191,319
Purchase Details
Closed on
Aug 11, 2017
Sold by
Lopatka Donna L Nitka and Kenneth F Nitka Declaration Of
Bought by
Virgil Jeffrey
Home Financials for this Owner
Home Financials are based on the most recent Mortgage that was taken out on this home.
Original Mortgage
$175,900
Outstanding Balance
$147,125
Interest Rate
3.96%
Mortgage Type
New Conventional
Estimated Equity
$191,319
Purchase Details
Closed on
Jul 3, 2013
Sold by
Nitka Kenneth F
Bought by
Nitka Kenneth F and Kenneth F Nitka No 7 2103
Purchase Details
Closed on
Mar 14, 2012
Sold by
Nitka Donna
Bought by
Nika Kennesth
Purchase Details
Closed on
Apr 15, 1997
Sold by
Rutkowski David W and Rutkowski Lee Ann
Bought by
Nitka Kenneth H and Nitka Donna
Home Financials for this Owner
Home Financials are based on the most recent Mortgage that was taken out on this home.
Original Mortgage
$117,587
Interest Rate
8.05%
Mortgage Type
FHA
Create a Home Valuation Report for This Property
The Home Valuation Report is an in-depth analysis detailing your home's value as well as a comparison with similar homes in the area
Home Values in the Area
Average Home Value in this Area
Purchase History
| Date | Buyer | Sale Price | Title Company |
|---|---|---|---|
| Virgil Jeffrey | $185,900 | Attorney | |
| Virgil Jeffrey | $185,900 | Attorney | |
| Nitka Kenneth F | -- | None Available | |
| Nika Kennesth | -- | None Available | |
| Nitka Kenneth H | $120,000 | -- |
Source: Public Records
Mortgage History
| Date | Status | Borrower | Loan Amount |
|---|---|---|---|
| Open | Virgil Jeffrey | $175,900 | |
| Closed | Virgil Jeffrey | $175,900 | |
| Previous Owner | Nitka Kenneth H | $117,587 |
Source: Public Records
Tax History Compared to Growth
Tax History
| Year | Tax Paid | Tax Assessment Tax Assessment Total Assessment is a certain percentage of the fair market value that is determined by local assessors to be the total taxable value of land and additions on the property. | Land | Improvement |
|---|---|---|---|---|
| 2024 | $7,513 | $89,350 | $20,729 | $68,621 |
| 2023 | $7,513 | $80,394 | $18,651 | $61,743 |
| 2022 | $6,431 | $71,058 | $16,485 | $54,573 |
| 2021 | $6,085 | $66,441 | $15,414 | $51,027 |
| 2020 | $5,893 | $64,256 | $14,907 | $49,349 |
| 2019 | $5,695 | $61,196 | $14,197 | $46,999 |
| 2018 | $5,282 | $56,855 | $13,189 | $43,666 |
| 2017 | $5,019 | $53,891 | $12,501 | $41,390 |
| 2016 | $4,865 | $51,300 | $11,900 | $39,400 |
| 2015 | $4,151 | $47,300 | $11,000 | $36,300 |
| 2014 | $4,151 | $43,400 | $10,100 | $33,300 |
| 2013 | $4,151 | $44,700 | $10,400 | $34,300 |
Source: Public Records
Map
Nearby Homes
- 23 Wildwood Ln Unit G
- 8 Wildwood Ln Unit G
- 11 Roanoke Ct
- 3 Roanoke Ct
- 223 Hywood Ln
- 227 Lexington Dr
- 2 Ava Ct
- 6 Allegheny Ct
- 3 Merrimack Ct
- 234 Dakota Ct Unit C
- 281 Dupage Dr
- 141 N Lancaster Dr
- 316 Pueblo Dr
- 112 Brook Ct
- 228 Elkhorn Ct Unit B
- 222 Aspen Ct
- 109 Arrowhead Ln
- 621 Sundance Dr
- 650 Sundance Dr
- 530 Cottonwood Cir