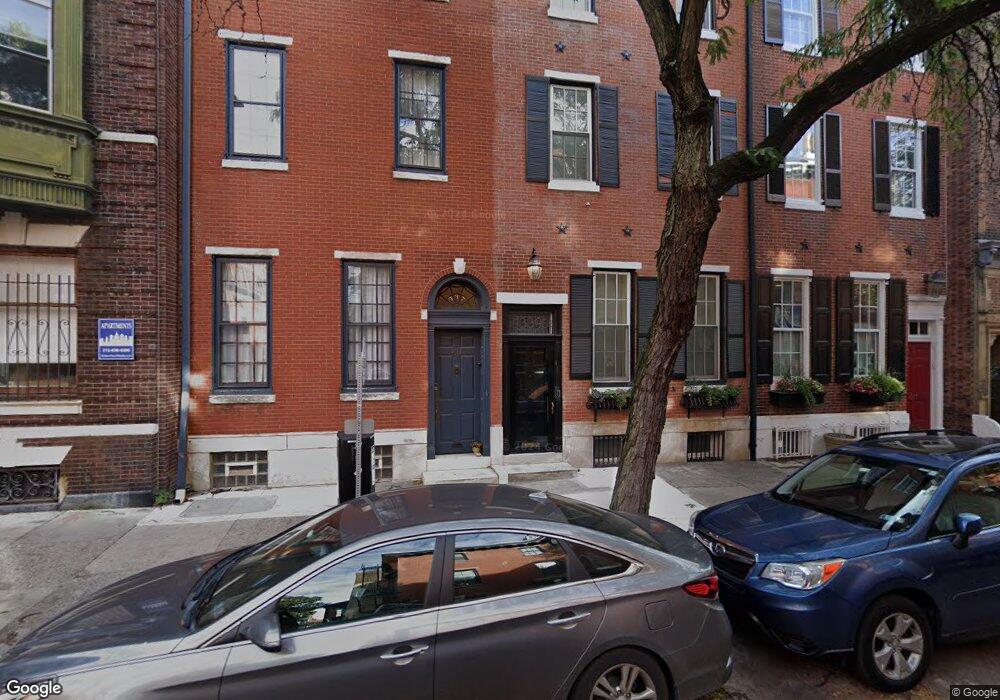
339 S 18th St Philadelphia, PA 19103
Rittenhouse Square NeighborhoodEstimated Value: $1,871,484 - $3,039,000
4
Beds
3
Baths
4,814
Sq Ft
$488/Sq Ft
Est. Value
About This Home
This home is located at 339 S 18th St, Philadelphia, PA 19103 and is currently estimated at $2,351,161, approximately $488 per square foot. 339 S 18th St is a home located in Philadelphia County with nearby schools including Albert M Greenfield School, Benjamin Franklin High School, and Independence Charter School.
Ownership History
Date
Name
Owned For
Owner Type
Purchase Details
Closed on
Jun 13, 2019
Sold by
Shilanco Properties Llc
Bought by
Leytes Dina and Subotnik Joseph Eli
Current Estimated Value
Home Financials for this Owner
Home Financials are based on the most recent Mortgage that was taken out on this home.
Original Mortgage
$140,000
Outstanding Balance
$123,094
Interest Rate
4.1%
Mortgage Type
New Conventional
Estimated Equity
$2,228,067
Purchase Details
Closed on
Jun 29, 2018
Sold by
Triester Karin Ellen and The Estate Of Stanton L Triest
Bought by
Shilanco Properties Llc
Home Financials for this Owner
Home Financials are based on the most recent Mortgage that was taken out on this home.
Original Mortgage
$1,100,000
Interest Rate
4.6%
Mortgage Type
Commercial
Purchase Details
Closed on
Dec 21, 1980
Bought by
Triester Stanton L
Create a Home Valuation Report for This Property
The Home Valuation Report is an in-depth analysis detailing your home's value as well as a comparison with similar homes in the area
Home Values in the Area
Average Home Value in this Area
Purchase History
| Date | Buyer | Sale Price | Title Company |
|---|---|---|---|
| Leytes Dina | $2,085,000 | Trident Land Transfer Co Lp | |
| Shilanco Properties Llc | $910,000 | None Available | |
| Triester Stanton L | -- | -- |
Source: Public Records
Mortgage History
| Date | Status | Borrower | Loan Amount |
|---|---|---|---|
| Open | Leytes Dina | $140,000 | |
| Previous Owner | Shilanco Properties Llc | $1,100,000 |
Source: Public Records
Tax History Compared to Growth
Tax History
| Year | Tax Paid | Tax Assessment Tax Assessment Total Assessment is a certain percentage of the fair market value that is determined by local assessors to be the total taxable value of land and additions on the property. | Land | Improvement |
|---|---|---|---|---|
| 2025 | $15,973 | $2,065,000 | $413,000 | $1,652,000 |
| 2024 | $15,973 | $2,065,000 | $413,000 | $1,652,000 |
| 2023 | $15,973 | $2,065,000 | $413,000 | $1,652,000 |
| 2022 | $15,685 | $1,141,056 | $413,000 | $728,056 |
| 2021 | $15,685 | $0 | $0 | $0 |
| 2020 | $15,685 | $0 | $0 | $0 |
| 2019 | $16,221 | $0 | $0 | $0 |
| 2018 | $11,775 | $0 | $0 | $0 |
| 2017 | $11,775 | $0 | $0 | $0 |
| 2016 | $11,775 | $0 | $0 | $0 |
| 2015 | $11,272 | $0 | $0 | $0 |
| 2014 | -- | $841,200 | $101,792 | $739,408 |
| 2012 | -- | $77,024 | $14,695 | $62,329 |
Source: Public Records
Map
Nearby Homes
- 1725 Pine St
- 325 S 18th St
- 1716 Spruce St Unit 4
- 1716 Spruce St Unit 3
- 1716 Spruce St Unit 6
- 1716 Spruce St Unit 8
- 1716 Spruce St Unit 1
- 1701 Pine St
- 1708 Pine St Unit 4
- 1716 00 Pine St Unit 7
- 1712 Pine St
- 1736 Spruce St
- 1808 Delancey Place
- 1723 Spruce St
- 1818 Delancey St
- 307 S Chadwick St
- 1716-18 Addison St
- 1708 Addison St
- 1819 Delancey Place
- 1805 Spruce St
- 337 S 18th St
- 341 S 18th St
- 343 S 18th St Unit 5
- 343 S 18th St Unit 4
- 343 S 18th St Unit 3
- 343 S 18th St Unit 2
- 343 S 18th St Unit 1
- 335 S 18th St
- 333 S 18th St Unit 1F
- 333 S 18th St Unit 3F
- 333 S 18th St Unit 2R
- 333 S 18th St Unit 3R
- 333 S 18th St Unit 2R
- 333 S 18th St Unit 3F
- 333 S 18th St Unit 3R
- 333 S 18th St Unit 1ST FLR
- 333 S 18th St
- 331 S 18th St Unit 3F
- 331 S 18th St Unit 1F
- 331 S 18th St Unit 1R