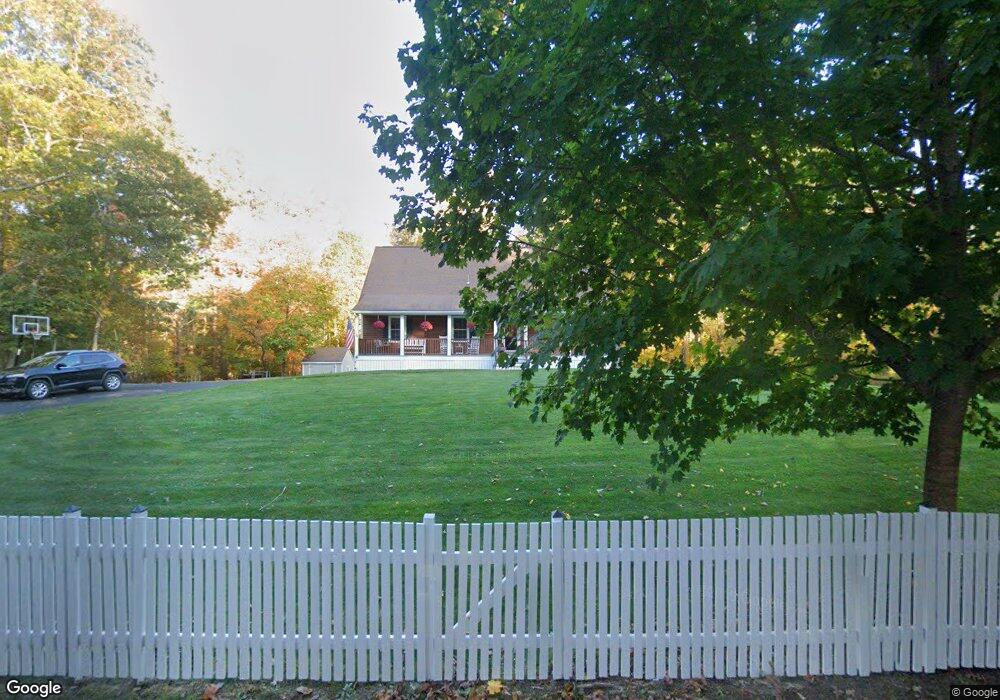
339 Spring St Marshfield, MA 02050
Estimated Value: $860,161 - $1,001,000
2
Beds
2
Baths
1,488
Sq Ft
$627/Sq Ft
Est. Value
About This Home
This home is located at 339 Spring St, Marshfield, MA 02050 and is currently estimated at $933,040, approximately $627 per square foot. 339 Spring St is a home located in Plymouth County with nearby schools including Martinson Elementary School, Furnace Brook Middle School, and Marshfield High School.
Ownership History
Date
Name
Owned For
Owner Type
Purchase Details
Closed on
Nov 30, 2018
Sold by
Kelley Joanne L
Bought by
Labate Bruce D and Kelley Joanne L
Current Estimated Value
Purchase Details
Closed on
Dec 17, 2010
Sold by
Labbate Bruce D
Bought by
Kelley Joanne T
Purchase Details
Closed on
Oct 19, 2007
Sold by
Labbate Bruce D
Bought by
Labbate Bruce D and Kelley Joanne T
Purchase Details
Closed on
Sep 15, 2004
Sold by
Chamberlain Ret
Bought by
Synco Nancy and Synco John C
Create a Home Valuation Report for This Property
The Home Valuation Report is an in-depth analysis detailing your home's value as well as a comparison with similar homes in the area
Home Values in the Area
Average Home Value in this Area
Purchase History
| Date | Buyer | Sale Price | Title Company |
|---|---|---|---|
| Labate Bruce D | -- | -- | |
| Kelley Joanne T | -- | -- | |
| Labbate Bruce D | -- | -- | |
| Synco Nancy | -- | -- |
Source: Public Records
Mortgage History
| Date | Status | Borrower | Loan Amount |
|---|---|---|---|
| Previous Owner | Synco Nancy | $214,000 | |
| Previous Owner | Synco Nancy | $216,300 |
Source: Public Records
Tax History
| Year | Tax Paid | Tax Assessment Tax Assessment Total Assessment is a certain percentage of the fair market value that is determined by local assessors to be the total taxable value of land and additions on the property. | Land | Improvement |
|---|---|---|---|---|
| 2025 | $8,357 | $844,100 | $392,900 | $451,200 |
| 2024 | $8,114 | $780,900 | $371,100 | $409,800 |
| 2023 | $7,567 | $690,600 | $334,700 | $355,900 |
| 2022 | $7,567 | $584,300 | $276,600 | $307,700 |
| 2021 | $7,128 | $540,400 | $265,700 | $274,700 |
| 2020 | $7,204 | $540,400 | $265,700 | $274,700 |
| 2019 | $6,603 | $493,500 | $236,500 | $257,000 |
| 2018 | $6,428 | $480,800 | $236,500 | $244,300 |
| 2017 | $6,234 | $454,400 | $236,500 | $217,900 |
| 2016 | $6,164 | $444,100 | $236,500 | $207,600 |
| 2015 | $5,902 | $444,100 | $236,500 | $207,600 |
| 2014 | $5,493 | $413,300 | $214,700 | $198,600 |
Source: Public Records
Map
Nearby Homes
- 32 Carolyn Cir
- 95 Stony Brook Ln
- 48 Neal Gate St
- 480 Pleasant St
- 9 Cushing Park Rd
- 3 Harbor Ln
- 1 Valley Path
- 55 Macombers Way
- 76 Macombers Way
- 17 Old Oaken Bucket Rd
- 19 Dunster Ln
- 19 Ford Place Unit 1
- 19 Ford Place Unit 2
- 94 Old Oaken Bucket Rd
- 1155 Main St
- 3 Webster Farm Way
- 5 Webster Farm Way
- 25 Webster Farm Way
- 23 Webster Farm Way
- 98 Satuit Trail
Your Personal Tour Guide
Ask me questions while you tour the home.