339 Spring St Marshfield, MA 02050
Estimated Value: $796,000 - $932,000
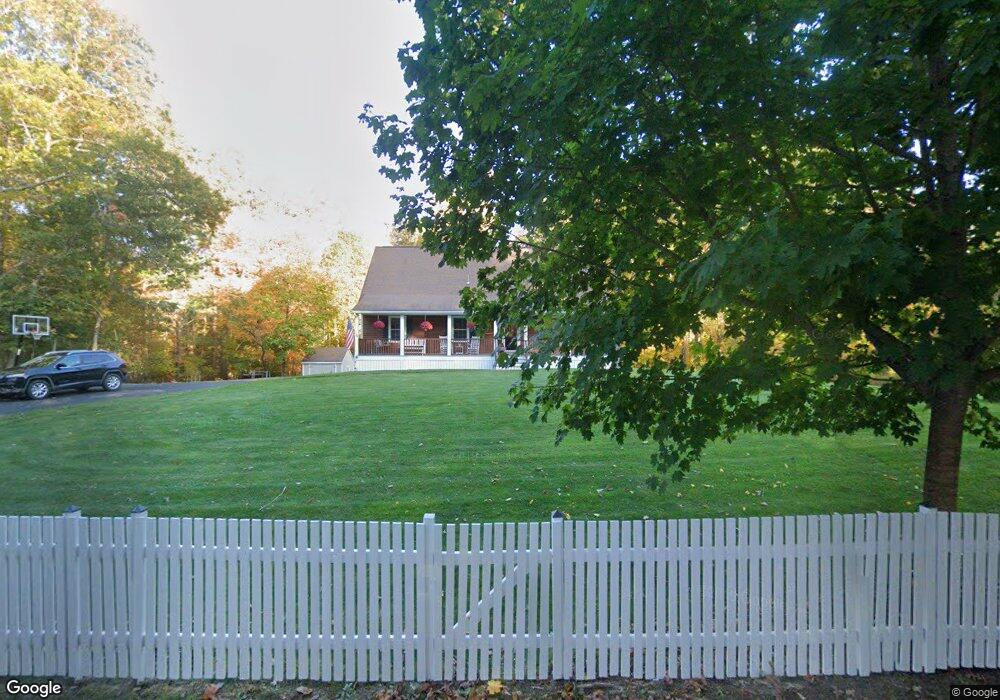
About This Home
This home is located at 339 Spring St, Marshfield, MA 02050 and is currently estimated at $867,005, approximately $582 per square foot. 339 Spring St is a home located in Plymouth County with nearby schools including Martinson Elementary School, Furnace Brook Middle School, and Marshfield High School.
Ownership History
We collect this data history from publicly available records. To have your information removed, we recommend requesting removal directly through your county’s website.
Purchase Details
Purchase Details
Purchase Details
Purchase Details
Home Values in the Area
Average Home Value in this Area
Purchase History
We collect this data history from publicly available records. To have your information removed, we recommend requesting removal directly through your county’s website.
| Date | Buyer | Sale Price | Title Company |
|---|---|---|---|
| -- | -- | ||
| -- | -- | ||
| -- | -- | ||
| -- | -- |
Mortgage History
We collect this data history from publicly available records. To have your information removed, we recommend requesting removal directly through your county’s website.
| Date | Status | Borrower | Loan Amount |
|---|---|---|---|
| Previous Owner | $214,000 | ||
| Previous Owner | $216,300 |
Tax History
We collect this data history from publicly available records. To have your information removed, we recommend requesting removal directly through your county’s website.
| Year | Tax Paid | Tax Assessment Tax Assessment Total Assessment is a certain percentage of the fair market value that is determined by local assessors to be the total taxable value of land and additions on the property. | Land | Improvement |
|---|---|---|---|---|
| 2025 | $8,357 | $844,100 | $392,900 | $451,200 |
| 2024 | $8,114 | $780,900 | $371,100 | $409,800 |
| 2023 | $7,567 | $690,600 | $334,700 | $355,900 |
| 2022 | $7,567 | $584,300 | $276,600 | $307,700 |
| 2021 | $7,128 | $540,400 | $265,700 | $274,700 |
| 2020 | $7,204 | $540,400 | $265,700 | $274,700 |
| 2019 | $6,603 | $493,500 | $236,500 | $257,000 |
| 2018 | $6,428 | $480,800 | $236,500 | $244,300 |
| 2017 | $6,234 | $454,400 | $236,500 | $217,900 |
| 2016 | $6,164 | $444,100 | $236,500 | $207,600 |
| 2015 | $5,902 | $444,100 | $236,500 | $207,600 |
| 2014 | $5,493 | $413,300 | $214,700 | $198,600 |
Map
- 512 Spring St
- 102 Riverside Cir
- 979 Summer St
- 95 Stony Brook Ln
- 17 Hannah Brook Waye Unit 9
- LOT 2 555 Highland St
- 85 Kings Landing
- 54 Old Meeting House Ln
- 1200 Forest St
- 44 Old Meeting House Ln
- 12 and 0 Hunter Dr
- 807 Summer St
- 1115 Forest St
- 17 Old Meeting House Ln
- 480 Pleasant St
- 26 Neal Gate St
- 6 Damons Point Dr
- 8 Bridge St
- 121 Hampstead Way
- 47 Fords Crossing
Ask me questions while you tour the home.