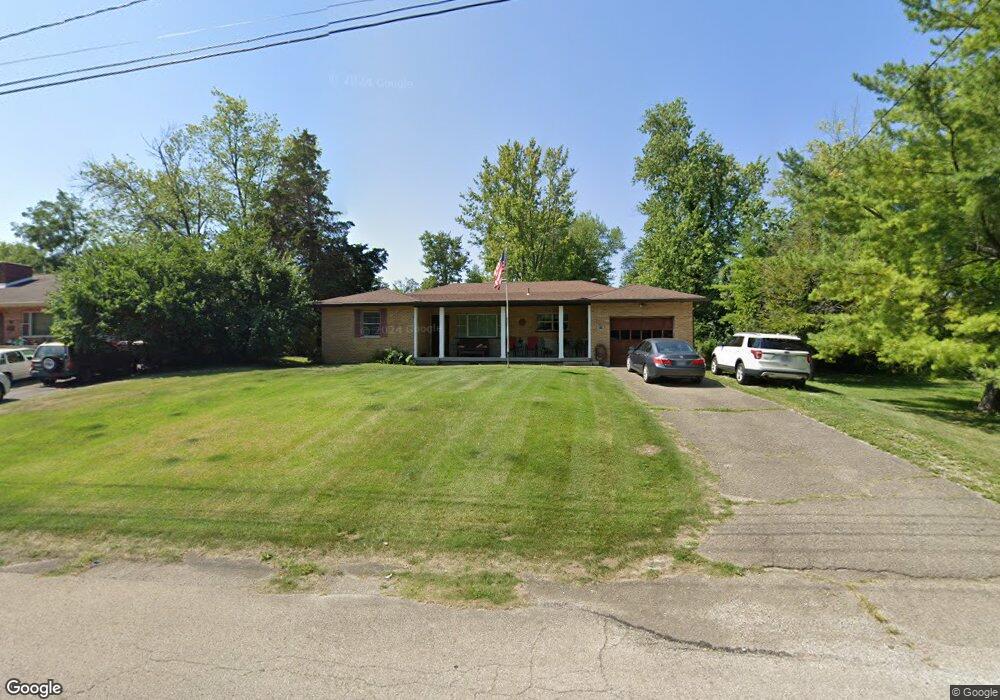
339 Spring St Williamsburg, OH 45176
Estimated Value: $217,932 - $237,000
3
Beds
2
Baths
1,538
Sq Ft
$149/Sq Ft
Est. Value
About This Home
This home is located at 339 Spring St, Williamsburg, OH 45176 and is currently estimated at $228,483, approximately $148 per square foot. 339 Spring St is a home located in Clermont County with nearby schools including Williamsburg Elementary School and Williamsburg High School.
Ownership History
Date
Name
Owned For
Owner Type
Purchase Details
Closed on
Oct 13, 2025
Sold by
Chapman Ronald L and Chapman Karen L
Bought by
Chapman Preservation Trust and Lefferson
Current Estimated Value
Purchase Details
Closed on
Apr 5, 2006
Sold by
Gardner Virginia N and Whitaker Judith A
Bought by
Chapman Ronald L and Chapman Karen L
Home Financials for this Owner
Home Financials are based on the most recent Mortgage that was taken out on this home.
Original Mortgage
$78,000
Interest Rate
6.48%
Mortgage Type
Fannie Mae Freddie Mac
Purchase Details
Closed on
Jul 2, 1984
Create a Home Valuation Report for This Property
The Home Valuation Report is an in-depth analysis detailing your home's value as well as a comparison with similar homes in the area
Home Values in the Area
Average Home Value in this Area
Purchase History
| Date | Buyer | Sale Price | Title Company |
|---|---|---|---|
| Chapman Preservation Trust | -- | None Listed On Document | |
| Chapman Ronald L | $115,000 | Advanced Land Title Agency | |
| -- | $54,800 | -- |
Source: Public Records
Mortgage History
| Date | Status | Borrower | Loan Amount |
|---|---|---|---|
| Previous Owner | Chapman Ronald L | $78,000 |
Source: Public Records
Tax History
| Year | Tax Paid | Tax Assessment Tax Assessment Total Assessment is a certain percentage of the fair market value that is determined by local assessors to be the total taxable value of land and additions on the property. | Land | Improvement |
|---|---|---|---|---|
| 2024 | $2,105 | $48,940 | $4,730 | $44,210 |
| 2023 | $2,108 | $48,940 | $4,730 | $44,210 |
| 2022 | $1,922 | $39,900 | $3,850 | $36,050 |
| 2021 | $1,726 | $39,900 | $3,850 | $36,050 |
| 2020 | $1,729 | $39,900 | $3,850 | $36,050 |
| 2019 | $1,993 | $44,700 | $3,640 | $41,060 |
| 2018 | $1,998 | $44,700 | $3,640 | $41,060 |
| 2017 | $1,947 | $43,650 | $3,640 | $40,010 |
| 2016 | $1,666 | $34,900 | $2,910 | $31,990 |
| 2015 | $1,605 | $34,900 | $2,910 | $31,990 |
| 2014 | $1,605 | $34,900 | $2,910 | $31,990 |
| 2013 | $1,529 | $32,660 | $4,100 | $28,560 |
Source: Public Records
Map
Nearby Homes
- 555 Spring St
- 171 N 4th St
- 192 N Broadway St
- 134 N Front St
- 114 Cornerstone Dr
- 115 Cornerstone Dr
- 111 Cornerstone Dr
- 120 Cornerstone Dr
- 122 Cornerstone Dr
- 124 Cornerstone Dr
- 126 Cornerstone Dr
- Acres Dela Palma Rd
- 133 Kelly Dr
- 117 Kelly Dr
- 3717 Cobb Rd
- 3518 Island Trail Dr
- 3657 Bootjack Corner Rd
- 4325 Half-Acre Rd
- 4145 Half Acre Rd
- 2100 James E Sauls Sr Dr
Your Personal Tour Guide
Ask me questions while you tour the home.