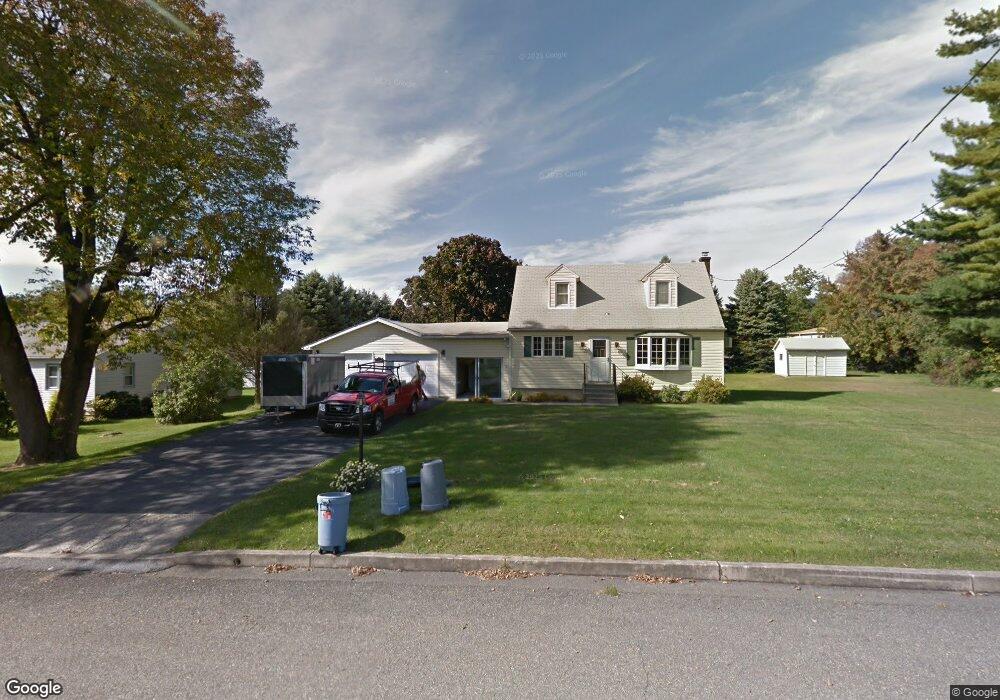
339 Spruce St Walnutport, PA 18088
Estimated Value: $274,000 - $316,000
3
Beds
2
Baths
1,155
Sq Ft
$254/Sq Ft
Est. Value
About This Home
This home is located at 339 Spruce St, Walnutport, PA 18088 and is currently estimated at $293,750, approximately $254 per square foot. 339 Spruce St is a home located in Northampton County with nearby schools including Deep Creek Central Elementary School, Grassfield Elementary School, and Slatington Elementary School.
Ownership History
Date
Name
Owned For
Owner Type
Purchase Details
Closed on
Sep 20, 2012
Sold by
Christman Dennis and Defrain Susan
Bought by
Defrain Jonathan D
Current Estimated Value
Home Financials for this Owner
Home Financials are based on the most recent Mortgage that was taken out on this home.
Original Mortgage
$100,000
Outstanding Balance
$69,359
Interest Rate
3.62%
Mortgage Type
New Conventional
Estimated Equity
$224,391
Purchase Details
Closed on
Oct 3, 2001
Bought by
Christman Dennis
Create a Home Valuation Report for This Property
The Home Valuation Report is an in-depth analysis detailing your home's value as well as a comparison with similar homes in the area
Home Values in the Area
Average Home Value in this Area
Purchase History
| Date | Buyer | Sale Price | Title Company |
|---|---|---|---|
| Defrain Jonathan D | -- | None Available | |
| Christman Dennis | -- | -- |
Source: Public Records
Mortgage History
| Date | Status | Borrower | Loan Amount |
|---|---|---|---|
| Open | Defrain Jonathan D | $100,000 |
Source: Public Records
Tax History Compared to Growth
Tax History
| Year | Tax Paid | Tax Assessment Tax Assessment Total Assessment is a certain percentage of the fair market value that is determined by local assessors to be the total taxable value of land and additions on the property. | Land | Improvement |
|---|---|---|---|---|
| 2025 | $598 | $55,400 | $20,100 | $35,300 |
| 2024 | $5,699 | $55,400 | $20,100 | $35,300 |
| 2023 | $5,476 | $55,400 | $20,100 | $35,300 |
| 2022 | $5,355 | $55,400 | $20,100 | $35,300 |
| 2021 | $5,348 | $55,400 | $20,100 | $35,300 |
| 2020 | $5,377 | $55,400 | $20,100 | $35,300 |
| 2019 | $5,234 | $55,400 | $20,100 | $35,300 |
| 2018 | $5,117 | $55,400 | $20,100 | $35,300 |
| 2017 | $5,190 | $55,400 | $20,100 | $35,300 |
| 2016 | -- | $55,400 | $20,100 | $35,300 |
| 2015 | -- | $55,400 | $20,100 | $35,300 |
| 2014 | -- | $55,400 | $20,100 | $35,300 |
Source: Public Records
Map
Nearby Homes