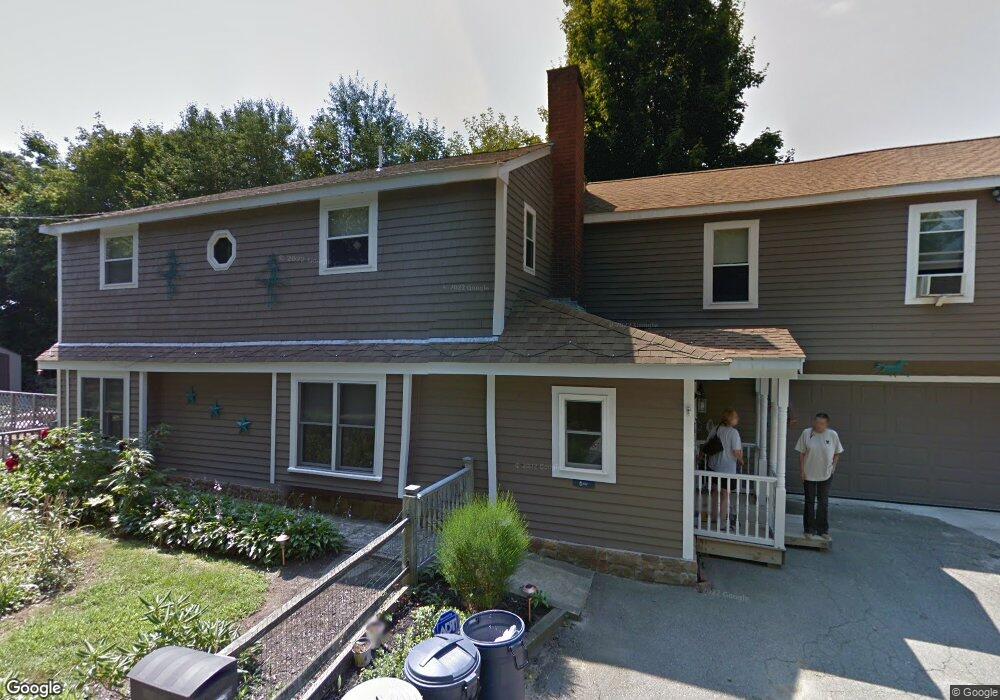
339 Summer St Weymouth, MA 02188
Weymouth Landing NeighborhoodEstimated Value: $666,314 - $908,000
Studio
3
Baths
2,618
Sq Ft
$305/Sq Ft
Est. Value
About This Home
This home is located at 339 Summer St, Weymouth, MA 02188 and is currently estimated at $798,079, approximately $304 per square foot. 339 Summer St is a home located in Norfolk County with nearby schools including Frederick C Murphy, Abigail Adams Middle School, and Weymouth Middle School Chapman.
Ownership History
Date
Name
Owned For
Owner Type
Purchase Details
Closed on
May 5, 1995
Sold by
Berkeley Fed B & T Fsb
Bought by
Murphy Ellen L
Current Estimated Value
Home Financials for this Owner
Home Financials are based on the most recent Mortgage that was taken out on this home.
Original Mortgage
$137,500
Interest Rate
8.36%
Mortgage Type
Purchase Money Mortgage
Purchase Details
Closed on
Mar 18, 1987
Sold by
Lukas Mark
Bought by
Murphy Ellen L
Home Financials for this Owner
Home Financials are based on the most recent Mortgage that was taken out on this home.
Original Mortgage
$126,500
Interest Rate
9.02%
Mortgage Type
Purchase Money Mortgage
Create a Home Valuation Report for This Property
The Home Valuation Report is an in-depth analysis detailing your home's value as well as a comparison with similar homes in the area
Home Values in the Area
Average Home Value in this Area
Purchase History
| Date | Buyer | Sale Price | Title Company |
|---|---|---|---|
| Murphy Ellen L | $175,000 | -- | |
| Murphy Ellen L | $132,000 | -- |
Source: Public Records
Mortgage History
| Date | Status | Borrower | Loan Amount |
|---|---|---|---|
| Closed | Murphy Ellen L | $137,500 | |
| Previous Owner | Murphy Ellen L | $126,500 |
Source: Public Records
Tax History
| Year | Tax Paid | Tax Assessment Tax Assessment Total Assessment is a certain percentage of the fair market value that is determined by local assessors to be the total taxable value of land and additions on the property. | Land | Improvement |
|---|---|---|---|---|
| 2025 | $5,972 | $591,300 | $218,500 | $372,800 |
| 2024 | $5,778 | $562,600 | $208,100 | $354,500 |
| 2023 | $5,591 | $535,000 | $192,700 | $342,300 |
| 2022 | $5,433 | $474,100 | $178,500 | $295,600 |
| 2021 | $5,202 | $443,100 | $178,500 | $264,600 |
| 2020 | $5,052 | $423,800 | $178,500 | $245,300 |
| 2019 | $4,926 | $406,400 | $171,600 | $234,800 |
| 2018 | $4,765 | $381,200 | $163,400 | $217,800 |
| 2017 | $4,540 | $354,400 | $155,700 | $198,700 |
| 2016 | $4,364 | $340,900 | $149,700 | $191,200 |
| 2015 | $4,178 | $323,900 | $149,700 | $174,200 |
| 2014 | $4,002 | $300,900 | $139,300 | $161,600 |
Source: Public Records
Map
Nearby Homes
- 82 Lester Ln
- 107 Summer St
- 501 Commerce Dr Unit 2310
- 501 Commerce Dr Unit 4308
- 33 Congress St
- 15 Summer St
- 31 Doris Rd
- 73 Ryder Rd
- 19 Vine St Unit 3
- 19 Vine St Unit 2
- 11 Richmond St
- 122 Washington St Unit Twenty-two
- 300 West St
- 25 Richmond St
- 17 Berean Way
- 37 Lantern Ln
- 8 Tara Dr Unit 4
- 8 Tara Dr Unit 5
- 41 Lantern Ln
- 432 Grove St
- 4 Sherricks Farm Rd
- 335 Summer St
- 10 Sherricks Farm Rd
- 00 Summer St
- 327 Summer St
- 20 Sherricks Farm Rd
- 1 Sherricks Farm Rd
- 342 Summer St
- 30 Off Summer St
- 28 Sherricks Farm Rd
- 19 Sherricks Farm Rd
- 338 Summer St
- 321 Summer St
- 7 Sherricks Farm Rd
- 332 Summer St
- 348 Summer St
- 351 Summer St
- 12 Lester Ln
- 324 Summer St
- 317 Summer St
Your Personal Tour Guide
Ask me questions while you tour the home.