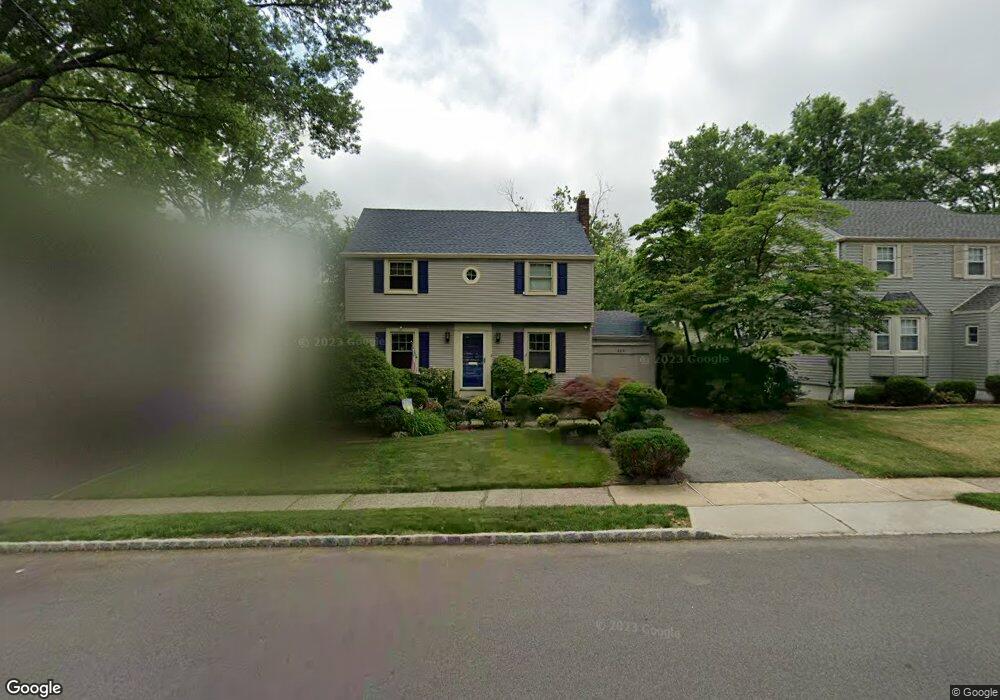
339 Sylvan Rd Bloomfield, NJ 07003
Estimated Value: $628,211 - $705,000
--
Bed
--
Bath
1,764
Sq Ft
$383/Sq Ft
Est. Value
About This Home
This home is located at 339 Sylvan Rd, Bloomfield, NJ 07003 and is currently estimated at $675,303, approximately $382 per square foot. 339 Sylvan Rd is a home located in Essex County with nearby schools including Oak View School, Bloomfield Middle School, and Bloomfield High School.
Ownership History
Date
Name
Owned For
Owner Type
Purchase Details
Closed on
Oct 30, 2001
Sold by
Jones Thomas
Bought by
Tham Nancy
Current Estimated Value
Home Financials for this Owner
Home Financials are based on the most recent Mortgage that was taken out on this home.
Original Mortgage
$265,600
Outstanding Balance
$103,427
Interest Rate
6.67%
Estimated Equity
$571,876
Purchase Details
Closed on
Jul 1, 1999
Sold by
Viglone Glen
Bought by
Janes Thomas and Janes Kristin
Home Financials for this Owner
Home Financials are based on the most recent Mortgage that was taken out on this home.
Original Mortgage
$208,000
Interest Rate
7.19%
Create a Home Valuation Report for This Property
The Home Valuation Report is an in-depth analysis detailing your home's value as well as a comparison with similar homes in the area
Home Values in the Area
Average Home Value in this Area
Purchase History
| Date | Buyer | Sale Price | Title Company |
|---|---|---|---|
| Tham Nancy | $332,000 | -- | |
| Janes Thomas | $219,900 | -- |
Source: Public Records
Mortgage History
| Date | Status | Borrower | Loan Amount |
|---|---|---|---|
| Open | Tham Nancy | $265,600 | |
| Previous Owner | Janes Thomas | $208,000 |
Source: Public Records
Tax History Compared to Growth
Tax History
| Year | Tax Paid | Tax Assessment Tax Assessment Total Assessment is a certain percentage of the fair market value that is determined by local assessors to be the total taxable value of land and additions on the property. | Land | Improvement |
|---|---|---|---|---|
| 2025 | $13,879 | $424,700 | $186,100 | $238,600 |
| 2024 | $13,879 | $424,700 | $186,100 | $238,600 |
| 2022 | $13,599 | $424,700 | $186,100 | $238,600 |
| 2021 | $13,348 | $424,700 | $186,100 | $238,600 |
| 2020 | $13,144 | $424,700 | $186,100 | $238,600 |
| 2019 | $13,416 | $337,000 | $174,000 | $163,000 |
| 2018 | $13,359 | $337,000 | $174,000 | $163,000 |
| 2017 | $13,156 | $337,000 | $174,000 | $163,000 |
| 2016 | $13,008 | $337,000 | $174,000 | $163,000 |
| 2015 | $12,890 | $337,000 | $174,000 | $163,000 |
| 2014 | $12,654 | $337,000 | $174,000 | $163,000 |
Source: Public Records
Map
Nearby Homes