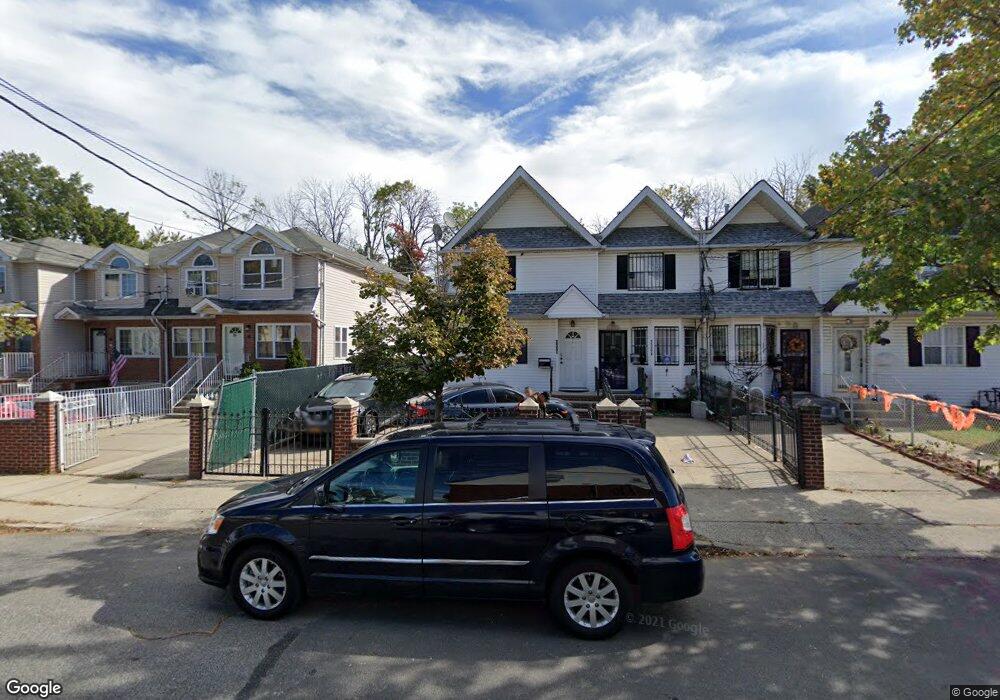
339 Van Pelt Ave Unit B Staten Island, NY 10303
Mariners Harbor NeighborhoodEstimated Value: $475,000 - $512,000
3
Beds
2
Baths
960
Sq Ft
$516/Sq Ft
Est. Value
About This Home
This home is located at 339 Van Pelt Ave Unit B, Staten Island, NY 10303 and is currently estimated at $495,700, approximately $516 per square foot. 339 Van Pelt Ave Unit B is a home located in Richmond County with nearby schools including P.S. 22 Graniteville, I.S. 51 Edwin Markham, and Port Richmond High School.
Ownership History
Date
Name
Owned For
Owner Type
Purchase Details
Closed on
Mar 25, 2011
Sold by
Ruiz Carmen
Bought by
Melendez Jose
Current Estimated Value
Home Financials for this Owner
Home Financials are based on the most recent Mortgage that was taken out on this home.
Original Mortgage
$204,704
Outstanding Balance
$140,387
Interest Rate
4.75%
Mortgage Type
FHA
Estimated Equity
$355,313
Purchase Details
Closed on
Dec 5, 2001
Sold by
Best Homes Llc
Bought by
Ruiz Carmen
Home Financials for this Owner
Home Financials are based on the most recent Mortgage that was taken out on this home.
Original Mortgage
$130,500
Interest Rate
6.91%
Mortgage Type
Purchase Money Mortgage
Purchase Details
Closed on
Feb 15, 2001
Sold by
Chandler Rhunette and Chandler Lynette
Bought by
Best Homes Llc
Create a Home Valuation Report for This Property
The Home Valuation Report is an in-depth analysis detailing your home's value as well as a comparison with similar homes in the area
Home Values in the Area
Average Home Value in this Area
Purchase History
| Date | Buyer | Sale Price | Title Company |
|---|---|---|---|
| Melendez Jose | $220,000 | None Available | |
| Ruiz Carmen | $145,000 | First American Title Ins | |
| Best Homes Llc | $103,000 | Fidelity National Title Ins |
Source: Public Records
Mortgage History
| Date | Status | Borrower | Loan Amount |
|---|---|---|---|
| Open | Melendez Jose | $204,704 | |
| Previous Owner | Ruiz Carmen | $130,500 |
Source: Public Records
Tax History Compared to Growth
Tax History
| Year | Tax Paid | Tax Assessment Tax Assessment Total Assessment is a certain percentage of the fair market value that is determined by local assessors to be the total taxable value of land and additions on the property. | Land | Improvement |
|---|---|---|---|---|
| 2025 | $3,477 | $26,640 | $3,265 | $23,375 |
| 2024 | $3,477 | $23,100 | $3,552 | $19,548 |
| 2023 | $3,317 | $16,332 | $3,242 | $13,090 |
| 2022 | $3,076 | $21,720 | $4,740 | $16,980 |
| 2021 | $3,243 | $19,500 | $4,740 | $14,760 |
| 2020 | $3,237 | $16,800 | $4,740 | $12,060 |
| 2019 | $3,018 | $18,240 | $4,740 | $13,500 |
| 2018 | $2,774 | $13,610 | $4,537 | $9,073 |
| 2017 | $2,617 | $12,840 | $4,740 | $8,100 |
| 2016 | $2,648 | $13,248 | $4,153 | $9,095 |
| 2015 | $2,510 | $13,248 | $3,807 | $9,441 |
| 2014 | $2,510 | $13,080 | $4,380 | $8,700 |
Source: Public Records
Map
Nearby Homes
- 336 van Name Ave
- 317 Van Pelt Ave
- 257 Maple Pkwy
- 22 Spirit Ln Unit 37
- 335 Simonson Ave
- 339 Lake Ave
- 331 Union Ave
- 73 Westbrook Ave
- 291 Simonson Ave
- 22 Confederation Place
- 128 Bruckner Ave
- 268 Bruckner Ave Unit 268
- 12 Doreen Dr
- 38 Eleanor Place
- 51 Adrianne Ln
- 201 van Name Ave
- 1816 Forest Ave
- 64 Gridley Ave
- 964 Richmond Ave
- 21 Carol Place
- 339 Van Pelt Ave Unit A
- 339B Van Pelt Ave
- 341A Van Pelt Ave
- 339A Van Pelt Ave
- 341B Van Pelt Ave
- 341 Van Pelt Ave Unit A
- 343 Van Pelt Ave
- 335 Van Pelt Ave
- 345 Van Pelt Ave
- 333 Van Pelt Ave Unit 335
- 333-335 Van Pelt Ave
- 347 Van Pelt Ave
- 337 Van Pelt Ave
- 337 Van Pelt Ave
- 331 Van Pelt Ave
- 349 Van Pelt Ave
- 329 Van Pelt Ave
- 340 van Name Ave
- 342 van Name Ave
- 338 van Name Ave