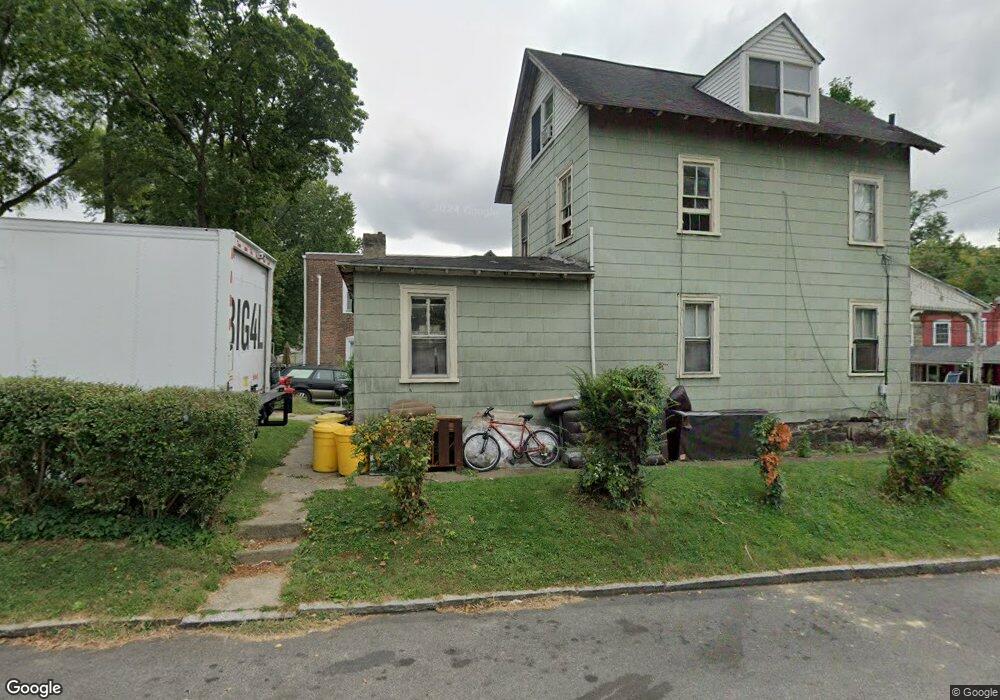
339 W Spring Ave Ardmore, PA 19003
Estimated Value: $383,336 - $435,000
4
Beds
2
Baths
1,479
Sq Ft
$277/Sq Ft
Est. Value
About This Home
This home is located at 339 W Spring Ave, Ardmore, PA 19003 and is currently estimated at $409,084, approximately $276 per square foot. 339 W Spring Ave is a home located in Montgomery County with nearby schools including Penn Wynne Elementary School, Bala-Cynwyd Middle School, and Lower Merion High School.
Ownership History
Date
Name
Owned For
Owner Type
Purchase Details
Closed on
Oct 14, 2008
Sold by
Lower Merion Affordable Housing
Bought by
Wynter Anderson Tracey Wynter
Current Estimated Value
Home Financials for this Owner
Home Financials are based on the most recent Mortgage that was taken out on this home.
Original Mortgage
$96,000
Outstanding Balance
$61,970
Interest Rate
5.83%
Estimated Equity
$347,114
Purchase Details
Closed on
Jan 25, 2008
Sold by
Green Kermit
Bought by
Lower Merion Affordable Housing
Purchase Details
Closed on
Dec 21, 2006
Sold by
Turner Yvonne
Bought by
Green Kermit
Purchase Details
Closed on
Apr 7, 1999
Sold by
Heyward Charles C and Heyward Carolyn K
Bought by
Turner Yvonne
Create a Home Valuation Report for This Property
The Home Valuation Report is an in-depth analysis detailing your home's value as well as a comparison with similar homes in the area
Home Values in the Area
Average Home Value in this Area
Purchase History
| Date | Buyer | Sale Price | Title Company |
|---|---|---|---|
| Wynter Anderson Tracey Wynter | $183,000 | None Available | |
| Lower Merion Affordable Housing | $135,000 | None Available | |
| Green Kermit | $265,000 | None Available | |
| Turner Yvonne | $80,000 | -- |
Source: Public Records
Mortgage History
| Date | Status | Borrower | Loan Amount |
|---|---|---|---|
| Open | Wynter Anderson Tracey Wynter | $96,000 |
Source: Public Records
Tax History Compared to Growth
Tax History
| Year | Tax Paid | Tax Assessment Tax Assessment Total Assessment is a certain percentage of the fair market value that is determined by local assessors to be the total taxable value of land and additions on the property. | Land | Improvement |
|---|---|---|---|---|
| 2025 | $3,296 | $78,910 | $23,890 | $55,020 |
| 2024 | $3,296 | $78,910 | $23,890 | $55,020 |
| 2023 | $3,158 | $78,910 | $23,890 | $55,020 |
| 2022 | $3,100 | $78,910 | $23,890 | $55,020 |
| 2021 | $3,029 | $78,910 | $23,890 | $55,020 |
| 2020 | $2,955 | $78,910 | $23,890 | $55,020 |
| 2019 | $2,903 | $78,910 | $23,890 | $55,020 |
| 2018 | $2,903 | $78,910 | $23,890 | $55,020 |
| 2017 | $2,796 | $78,910 | $23,890 | $55,020 |
| 2016 | $2,766 | $78,910 | $23,890 | $55,020 |
| 2015 | $2,579 | $78,910 | $23,890 | $55,020 |
| 2014 | $2,579 | $78,910 | $23,890 | $55,020 |
Source: Public Records
Map
Nearby Homes
- 236 W Spring Ave
- 250 Montgomery Ave Unit B
- 237 W Montgomery Ave Unit 3R
- 101 Cheswold Ln Unit 5-E
- 101 Cheswold Ln Unit 2F
- 101 Cheswold Ln Unit 3A
- 264 W Montgomery Ave Unit 304
- 221 Ardmore Ave
- 818 Clifford Ave
- 103 W Montgomery Ave Unit 1A
- 100 Grays Ln Unit 500
- 100 Grays Ln Unit 400
- 432 Montgomery Ave Unit 401
- 432 W Montgomery Ave Unit 402
- 1968 W Montgomery Ave
- 222 Lippincott Ave
- 140 Walnut Ave
- 2939 Berkley Rd
- 449 Montgomery Ave Unit 112
- 64 E Spring Ave
- 337 W Spring Ave
- 341 W Spring Ave
- 335 W Spring Ave
- 347 W Spring Ave
- 333 W Spring Ave
- 331 W Spring Ave
- 329 W Spring Ave
- 111 Armat Ave
- 334 Locust Ave
- 330 Locust Ave
- 327 W Spring Ave
- 358 W Spring Ave
- 360 W Spring Ave
- 356 W Spring Ave
- 362 W Spring Ave
- 354 W Spring Ave
- 364 W Spring Ave
- 352 W Spring Ave
- 366 W Spring Ave
- 350 W Spring Ave