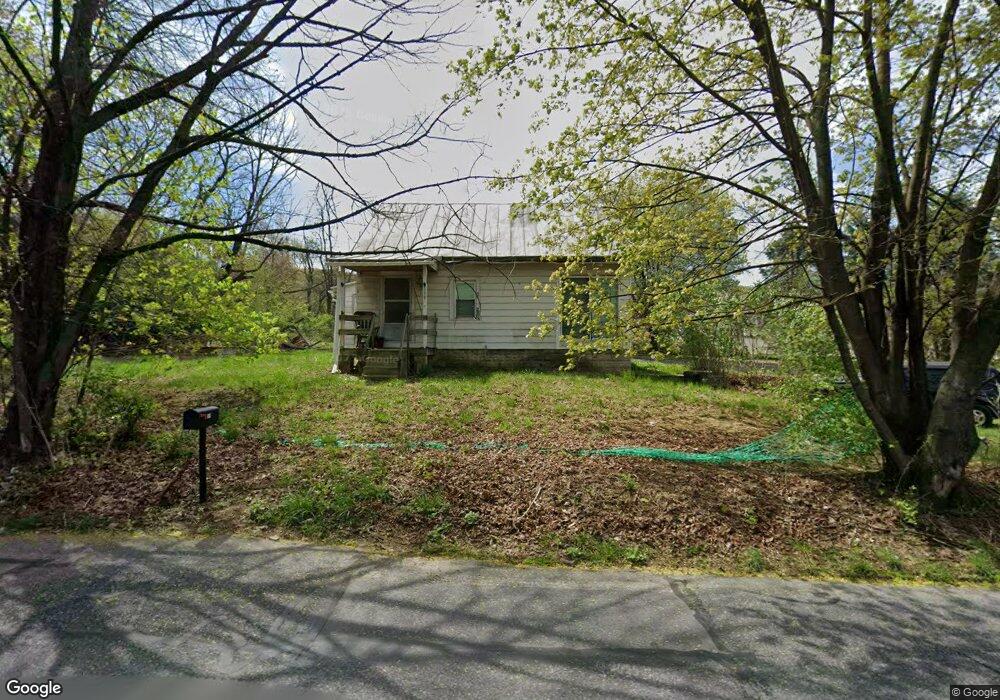
339 W Wesner Rd Reading, PA 19605
Estimated Value: $219,000 - $276,000
3
Beds
3
Baths
1,739
Sq Ft
$137/Sq Ft
Est. Value
About This Home
This home is located at 339 W Wesner Rd, Reading, PA 19605 and is currently estimated at $238,686, approximately $137 per square foot. 339 W Wesner Rd is a home located in Berks County with nearby schools including Andrew Maier El School, Fleetwood Middle School, and Fleetwood Senior High School.
Ownership History
Date
Name
Owned For
Owner Type
Purchase Details
Closed on
May 23, 2022
Sold by
Enright Eileen M
Bought by
Enright Eileen M
Current Estimated Value
Purchase Details
Closed on
May 6, 2022
Sold by
Enright Eileen M
Bought by
Enright Eileen M
Purchase Details
Closed on
Jan 15, 2019
Sold by
Medaglia Larry
Bought by
Perrin Robert A
Purchase Details
Closed on
May 27, 2009
Sold by
Reifsnyder Franklin W
Bought by
Machemer Patricia A
Purchase Details
Closed on
Aug 6, 2001
Sold by
Federal Home Loan Mortgage Corporation
Bought by
Reifsnyder Franklin W
Home Financials for this Owner
Home Financials are based on the most recent Mortgage that was taken out on this home.
Original Mortgage
$50,800
Interest Rate
6.99%
Purchase Details
Closed on
May 18, 2001
Sold by
Fink Bradley E and Fink Tara D
Bought by
Federal Home Loan Mortgage Corporation
Create a Home Valuation Report for This Property
The Home Valuation Report is an in-depth analysis detailing your home's value as well as a comparison with similar homes in the area
Home Values in the Area
Average Home Value in this Area
Purchase History
| Date | Buyer | Sale Price | Title Company |
|---|---|---|---|
| Enright Eileen M | -- | Lau & Associates Pc | |
| Enright Eileen M | -- | Lau & Associates Pc | |
| Perrin Robert A | -- | None Available | |
| Machemer Patricia A | $7,000 | None Available | |
| Reifsnyder Franklin W | $63,500 | -- | |
| Federal Home Loan Mortgage Corporation | $2,200 | -- |
Source: Public Records
Mortgage History
| Date | Status | Borrower | Loan Amount |
|---|---|---|---|
| Previous Owner | Reifsnyder Franklin W | $50,800 |
Source: Public Records
Tax History Compared to Growth
Tax History
| Year | Tax Paid | Tax Assessment Tax Assessment Total Assessment is a certain percentage of the fair market value that is determined by local assessors to be the total taxable value of land and additions on the property. | Land | Improvement |
|---|---|---|---|---|
| 2025 | $1,130 | $76,000 | $43,700 | $32,300 |
| 2024 | $3,500 | $76,000 | $43,700 | $32,300 |
| 2023 | $3,269 | $76,000 | $43,700 | $32,300 |
| 2022 | $3,250 | $76,000 | $43,700 | $32,300 |
| 2021 | $3,250 | $76,000 | $43,700 | $32,300 |
| 2020 | $3,231 | $76,000 | $43,700 | $32,300 |
| 2019 | $3,231 | $76,000 | $43,700 | $32,300 |
| 2018 | $3,189 | $76,000 | $43,700 | $32,300 |
| 2017 | $3,111 | $76,000 | $43,700 | $32,300 |
| 2016 | $679 | $76,000 | $43,700 | $32,300 |
| 2015 | $679 | $76,000 | $43,700 | $32,300 |
| 2014 | $679 | $76,000 | $43,700 | $32,300 |
Source: Public Records
Map
Nearby Homes
- 185 W Wesner Rd
- 72A Dries Rd
- 5700 Allentown Pike
- 130 Dries Rd
- 71 Cornerstone Dr
- 104 White Birch Ln
- 317 White Birch Ln
- 14 Grove Rd
- 171 Austrian Dr
- 173 Austrian Dr
- 175 Austrian Dr
- 179 Austrian Dr
- 181 Austrian Dr
- 0 Revere Plan at Ontelaunee Heights Unit PABK2060900
- 0 Emily Plan at Ontelaunee Heights Unit PABK2060844
- 0 Black Cherry Plan at Ontelaunee Heights Unit PABK2060838
- 185 Austrian Dr
- 0 Brindlee Plan at Ontelaunee Heights Unit PABK2060842
- 0 Heights Unit PABK2060834
- 0 Blue Ridge Plan at Ontelaunee Heights Unit PABK2060840
- 350 W Wesner Rd
- 315 W Wesner Rd
- 327 W Wesner Rd
- 318 W Wesner Rd
- 1137 Park Rd
- 1160 Park Rd
- 1133 Park Rd
- 51 W Bertolet Place
- 100 E Bertolet Place
- 287 W Wesner Rd
- 1121 Park Rd
- 1117 Park Rd
- 124 E Bertolet Place
- 1113 Park Rd
- 1111 Park Rd
- 75 W Bertolet Place
- 231 E Wesner Rd
- 64 Steiner Place
- 76 Steiner Place
- 1105 Park Rd