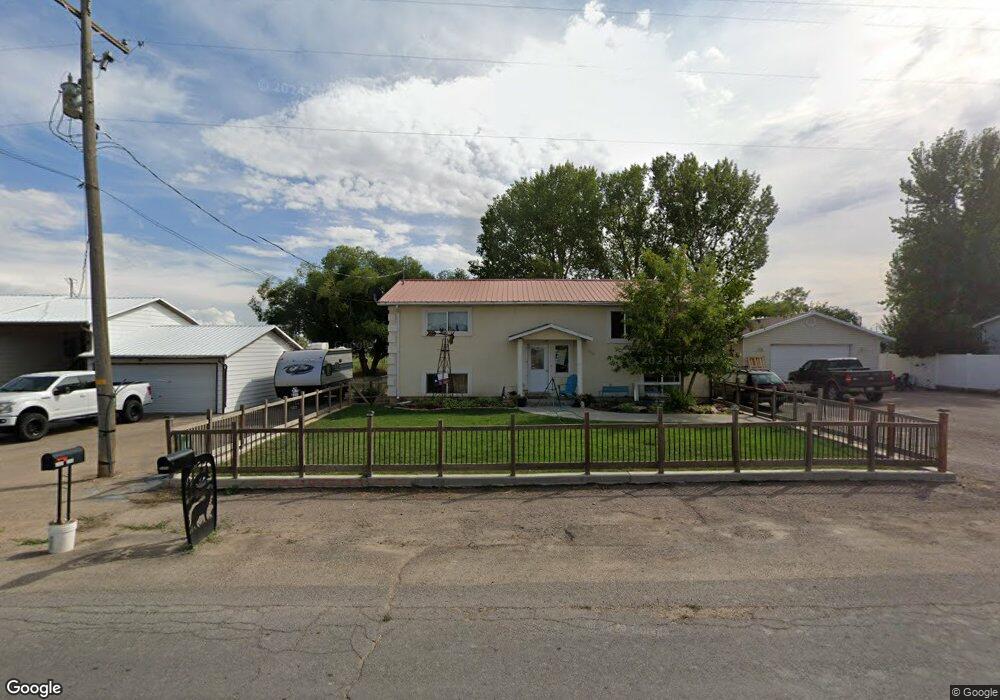
3390 E 3500 S Vernal, UT 84078
Estimated Value: $315,000 - $408,000
4
Beds
3
Baths
2,320
Sq Ft
$158/Sq Ft
Est. Value
About This Home
This home is located at 3390 E 3500 S, Vernal, UT 84078 and is currently estimated at $366,037, approximately $157 per square foot. 3390 E 3500 S is a home located in Uintah County with nearby schools including Davis School, Vernal Middle School, and Uintah Middle School.
Ownership History
Date
Name
Owned For
Owner Type
Purchase Details
Closed on
May 1, 2021
Sold by
Henderson Brenda and Henderson Philip
Bought by
Crist Brian and Crist Kimberly
Current Estimated Value
Home Financials for this Owner
Home Financials are based on the most recent Mortgage that was taken out on this home.
Original Mortgage
$220,500
Outstanding Balance
$198,764
Interest Rate
2.9%
Mortgage Type
New Conventional
Estimated Equity
$167,273
Purchase Details
Closed on
Dec 24, 2008
Sold by
Randall Douglas Jay
Bought by
Henderson Brenda and Henderson Philip
Purchase Details
Closed on
Feb 16, 2006
Sold by
Jorgensen Misty L and Stelly Misty L
Bought by
Randall Douglas Jay
Home Financials for this Owner
Home Financials are based on the most recent Mortgage that was taken out on this home.
Original Mortgage
$179,095
Interest Rate
6.2%
Mortgage Type
FHA
Purchase Details
Closed on
May 12, 2005
Sold by
Stelly Richard
Bought by
Stelly Misty L
Create a Home Valuation Report for This Property
The Home Valuation Report is an in-depth analysis detailing your home's value as well as a comparison with similar homes in the area
Home Values in the Area
Average Home Value in this Area
Purchase History
| Date | Buyer | Sale Price | Title Company |
|---|---|---|---|
| Crist Brian | -- | None Available | |
| Henderson Brenda | -- | -- | |
| Randall Douglas Jay | -- | -- | |
| Stelly Misty L | -- | -- |
Source: Public Records
Mortgage History
| Date | Status | Borrower | Loan Amount |
|---|---|---|---|
| Open | Crist Brian | $220,500 | |
| Previous Owner | Randall Douglas Jay | $179,095 |
Source: Public Records
Tax History Compared to Growth
Tax History
| Year | Tax Paid | Tax Assessment Tax Assessment Total Assessment is a certain percentage of the fair market value that is determined by local assessors to be the total taxable value of land and additions on the property. | Land | Improvement |
|---|---|---|---|---|
| 2024 | $1,555 | $174,604 | $18,768 | $155,836 |
| 2023 | $1,555 | $148,631 | $18,768 | $129,863 |
| 2022 | $1,335 | $122,659 | $18,768 | $103,891 |
| 2021 | $1,387 | $57,939 | $10,322 | $47,617 |
| 2020 | $1,223 | $95,139 | $19,250 | $75,889 |
| 2019 | $1,168 | $90,174 | $19,250 | $70,924 |
| 2018 | $1,125 | $86,797 | $19,250 | $67,547 |
| 2017 | $11 | $86,797 | $19,250 | $67,547 |
| 2016 | $1,126 | $96,623 | $19,250 | $77,373 |
| 2015 | $1,099 | $102,251 | $19,250 | $83,001 |
| 2014 | $1,042 | $98,299 | $19,250 | $79,049 |
| 2013 | $1,064 | $98,299 | $19,250 | $79,049 |
Source: Public Records
Map
Nearby Homes
- 3331 E 3500 S Unit 4
- 3311 E 3500 S Unit 3
- 3134 E 3500 S
- 3541 U S Highway 40
- 4093 E 4000 S
- 4111 E 4000 S
- 3758 S 2500 E
- 3310 S 2500 E
- 3060 S 2500 E
- 2308 E Highway 40
- 4361 S 2280 E
- 1971 E 3050 S
- 3340 E 5000 S
- 3104 E 5000 S
- 3998 E 5000 S
- 3538 E 5000 S Unit C
- 3534 E 5000 S Unit B
- 3447 E 5300 S
- 1801 E 4500 S
- 3000 S 1500 E