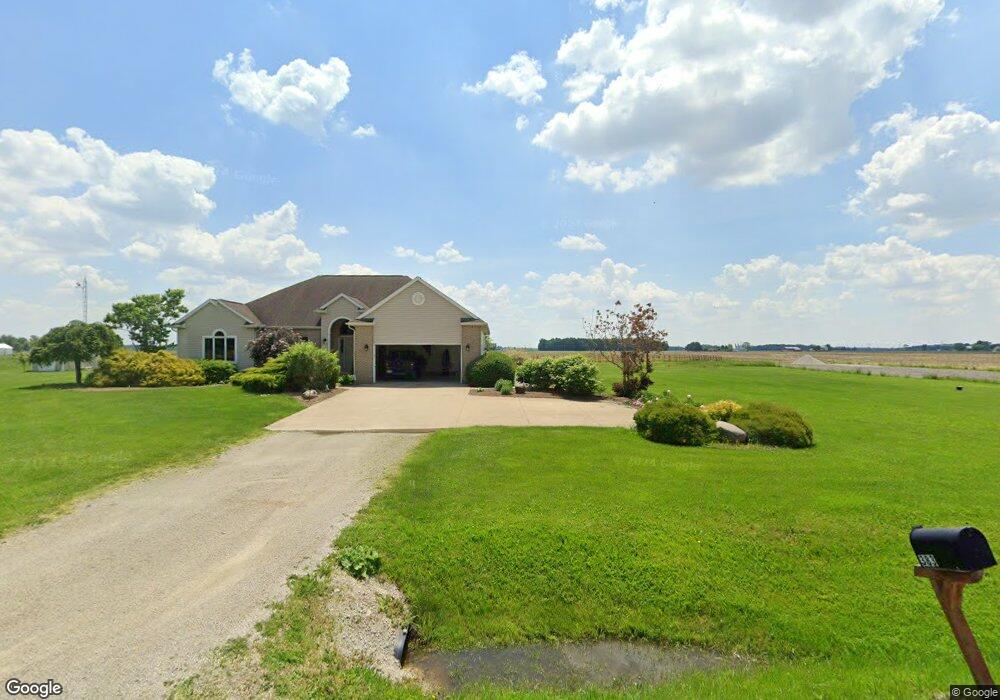
3390 N State Route 19 Fremont, OH 43420
Estimated Value: $971,280
3
Beds
2
Baths
1,694
Sq Ft
$573/Sq Ft
Est. Value
About This Home
This home is located at 3390 N State Route 19, Fremont, OH 43420 and is currently estimated at $971,280, approximately $573 per square foot. 3390 N State Route 19 is a home located in Sandusky County with nearby schools including Fremont Ross High School, St. Ann Catholic School, and St. Joseph School.
Ownership History
Date
Name
Owned For
Owner Type
Purchase Details
Closed on
Dec 22, 2020
Sold by
Weickert Charles A and Weickert Robin K
Bought by
Keller Stephen S and Weickert Farm Trust
Current Estimated Value
Purchase Details
Closed on
Apr 4, 2019
Sold by
Pfefferi Kathryn A and Kuzma Bonnie K
Bought by
Schneider Patrick A and Schneider Judith A
Purchase Details
Closed on
Apr 26, 2018
Sold by
Pefferle Kathryn A and Kuzma Bonnie K
Bought by
Weickert Farms Llc
Purchase Details
Closed on
Apr 15, 2003
Sold by
Schneider Bernard E and Schneider Elizabeth J
Bought by
Schneider Bernard E and Schneider Elizabeth J
Purchase Details
Closed on
Aug 1, 1993
Sold by
Schneider Bernard E An
Bought by
Schneider Bernard E and Schneider Elizabeth J
Purchase Details
Closed on
Dec 1, 1987
Bought by
Schneider Bernard E and Schneider Elizabeth J
Create a Home Valuation Report for This Property
The Home Valuation Report is an in-depth analysis detailing your home's value as well as a comparison with similar homes in the area
Home Values in the Area
Average Home Value in this Area
Purchase History
| Date | Buyer | Sale Price | Title Company |
|---|---|---|---|
| Keller Stephen S | -- | None Available | |
| Schneider Patrick A | -- | None Available | |
| Weickert Farms Llc | $640,000 | First American Title Ins | |
| Pefferele Jkathryn A | -- | First American Title | |
| Schneider Patrick A | -- | First American Title | |
| Schneider Bernard E | -- | -- | |
| Schneider Bernard E | -- | -- | |
| Schneider Bernard E | -- | -- |
Source: Public Records
Tax History Compared to Growth
Tax History
| Year | Tax Paid | Tax Assessment Tax Assessment Total Assessment is a certain percentage of the fair market value that is determined by local assessors to be the total taxable value of land and additions on the property. | Land | Improvement |
|---|---|---|---|---|
| 2024 | $4,635 | $246,720 | $246,720 | $0 |
| 2023 | $4,635 | $197,370 | $197,370 | $0 |
| 2022 | $2,724 | $197,370 | $197,370 | $0 |
| 2021 | $2,808 | $197,370 | $197,370 | $0 |
| 2020 | $3,669 | $190,370 | $190,370 | $0 |
| 2019 | $3,665 | $190,370 | $190,370 | $0 |
| 2018 | $3,671 | $190,370 | $190,370 | $0 |
| 2017 | $6,539 | $239,090 | $206,640 | $32,450 |
| 2016 | $5,776 | $239,090 | $206,640 | $32,450 |
| 2015 | $5,686 | $239,090 | $206,640 | $32,450 |
| 2014 | $3,809 | $193,630 | $162,020 | $31,610 |
| 2013 | $3,730 | $193,630 | $162,020 | $31,610 |
Source: Public Records
Map
Nearby Homes
- 2219 Oak Harbor Rd
- 0 Sean Dr
- Outlot A Sean Dr
- 1548 County Road 128
- 3285 County Road 170
- 1441 White Ave
- 1730 Port Clinton Rd Unit 41
- 1730 Port Clinton Rd
- 1730 Port Clinton Rd Unit 33
- 1720 North St
- 1548 North St
- 1227 White Ave
- 2100 Ohio 53
- 816 Lime St
- 927 Wolfe Ave
- 1823 W State St
- 900 Spring St
- 818 Franklin Ave
- 711 Rawson Ave
- 2119 Lake St
- 383 County Road 97
- 3383 N State Route 19
- 3355 N State Route 19
- 380 Cr 97
- 380 County Road 97
- 3379 N State Route 19
- 3518 Oak Harbor Rd
- 470 County Road 97
- 3287 N State Route 19
- 3521 Oak Harbor Rd
- 555 County Road 97
- 260 W County Road 89
- 376 W County Road 89
- 3575 Oak Harbor Rd
- 3575 Ohio 19
- 630 County Road 97
- 645 County Road 97
- 650 County Road 97
- 595 W County Road 89
- 150 E Co Road 89