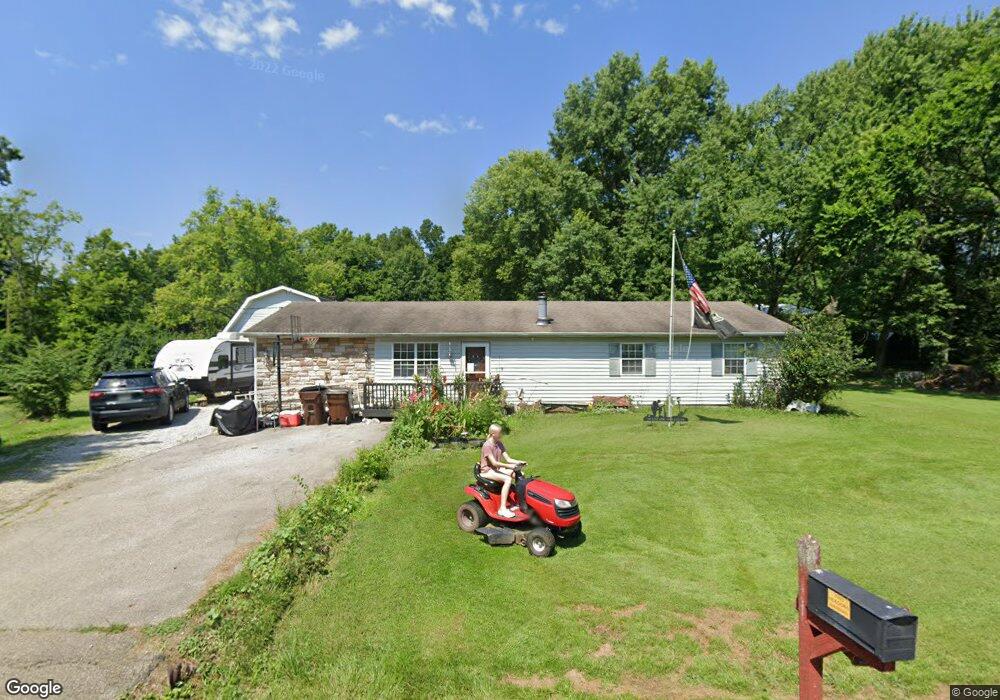
3393 Chery Ln Amelia, OH 45102
Estimated Value: $134,678 - $280,000
4
Beds
1
Bath
1,674
Sq Ft
$131/Sq Ft
Est. Value
About This Home
This home is located at 3393 Chery Ln, Amelia, OH 45102 and is currently estimated at $218,670, approximately $130 per square foot. 3393 Chery Ln is a home located in Clermont County with nearby schools including Amelia Elementary School, West Clermont Middle School, and West Clermont High School.
Ownership History
Date
Name
Owned For
Owner Type
Purchase Details
Closed on
Dec 6, 2024
Sold by
Meadors Shannon D and Meadors Candace
Bought by
Warman David
Current Estimated Value
Home Financials for this Owner
Home Financials are based on the most recent Mortgage that was taken out on this home.
Original Mortgage
$127,000
Outstanding Balance
$126,001
Interest Rate
6.79%
Mortgage Type
New Conventional
Estimated Equity
$92,669
Purchase Details
Closed on
May 19, 2011
Sold by
Knight Deborah L
Bought by
Meadors Shannon D
Home Financials for this Owner
Home Financials are based on the most recent Mortgage that was taken out on this home.
Original Mortgage
$97,465
Interest Rate
5.5%
Mortgage Type
FHA
Purchase Details
Closed on
Feb 23, 2011
Sold by
Knight Thomas L
Bought by
Knight Deborah L
Purchase Details
Closed on
Jun 1, 1988
Create a Home Valuation Report for This Property
The Home Valuation Report is an in-depth analysis detailing your home's value as well as a comparison with similar homes in the area
Home Values in the Area
Average Home Value in this Area
Purchase History
| Date | Buyer | Sale Price | Title Company |
|---|---|---|---|
| Warman David | $127,000 | None Listed On Document | |
| Warman David | $127,000 | None Listed On Document | |
| Meadors Shannon D | $100,000 | Attorney | |
| Knight Deborah L | -- | Attorney | |
| -- | $48,800 | -- |
Source: Public Records
Mortgage History
| Date | Status | Borrower | Loan Amount |
|---|---|---|---|
| Open | Warman David | $127,000 | |
| Closed | Warman David | $127,000 | |
| Previous Owner | Meadors Shannon D | $97,465 |
Source: Public Records
Tax History Compared to Growth
Tax History
| Year | Tax Paid | Tax Assessment Tax Assessment Total Assessment is a certain percentage of the fair market value that is determined by local assessors to be the total taxable value of land and additions on the property. | Land | Improvement |
|---|---|---|---|---|
| 2024 | $3,305 | $64,720 | $13,580 | $51,140 |
| 2023 | $3,310 | $64,720 | $13,580 | $51,140 |
| 2022 | $2,718 | $46,200 | $9,520 | $36,680 |
| 2021 | $2,687 | $46,200 | $9,520 | $36,680 |
| 2020 | $2,688 | $46,200 | $9,520 | $36,680 |
| 2019 | $2,080 | $38,820 | $10,080 | $28,740 |
| 2018 | $2,100 | $38,820 | $10,080 | $28,740 |
| 2017 | $2,128 | $38,820 | $10,080 | $28,740 |
| 2016 | $2,015 | $33,740 | $8,750 | $24,990 |
| 2015 | $1,889 | $33,740 | $8,750 | $24,990 |
| 2014 | $1,889 | $33,740 | $8,750 | $24,990 |
| 2013 | $1,757 | $31,190 | $8,750 | $22,440 |
Source: Public Records
Map
Nearby Homes
- 3371 Cole Rd
- 3478 Hickory Ln
- 3322 Cole Rd
- 2 Sparrow Ln
- 3952 Merwin Farms
- 1466 Locust Lake Rd
- 19 Bobwhite Ct
- 8 Mynah Dr
- 53 Gladiola Way
- 3394 Merwin 10 Mile Rd
- 3505 Holly Ridge Dr
- 61 Goldfish Ln
- 3396 Merwin 10 Mile Rd
- 28 Hunters Ct Unit 809F
- 10 Hunters Ct
- 4 Hunters Ct
- 57 Marigold Ln
- 3454 Ballymore Ct
- 3330 Huntsman Trace Unit 803C
- 3492 Ballymore Ct