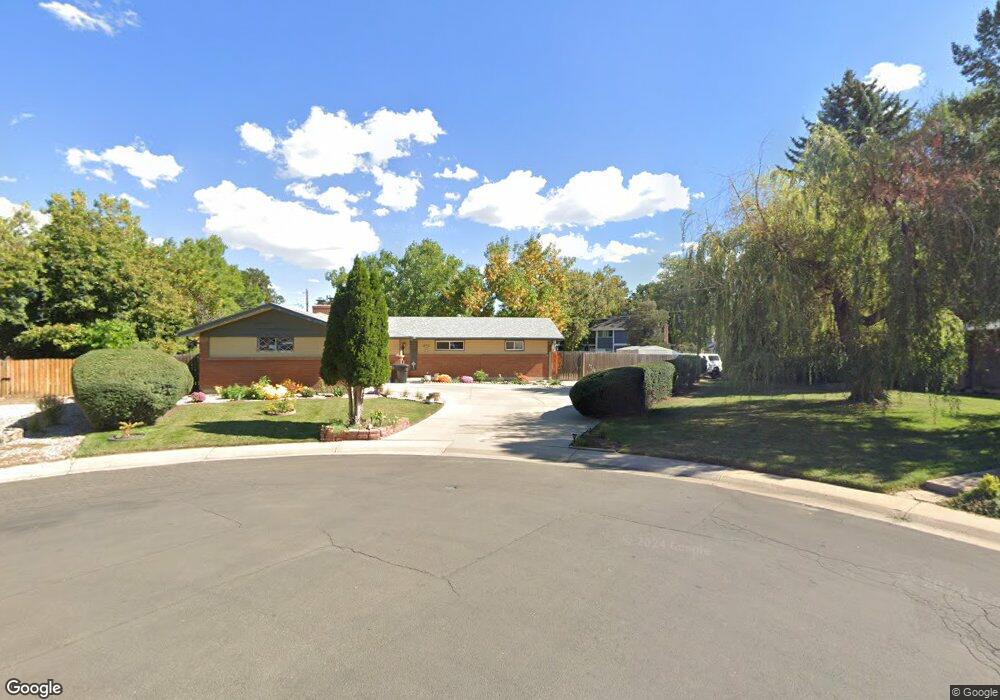
3394 S Elmira Ct Denver, CO 80231
Hampden NeighborhoodEstimated Value: $615,000 - $737,000
3
Beds
3
Baths
1,498
Sq Ft
$450/Sq Ft
Est. Value
About This Home
This home is located at 3394 S Elmira Ct, Denver, CO 80231 and is currently estimated at $674,066, approximately $449 per square foot. 3394 S Elmira Ct is a home located in Denver County with nearby schools including Joe Shoemaker School, Holm Elementary School, and Samuels Elementary School.
Ownership History
Date
Name
Owned For
Owner Type
Purchase Details
Closed on
Jul 17, 2007
Sold by
Seedorf Erin J and Seedorf Kyle P
Bought by
Jackson John H and Jackson Anne M
Current Estimated Value
Purchase Details
Closed on
Sep 4, 2003
Sold by
Denney Francis A and Denney Patricia
Bought by
Seedorf Erin J and Seedorf Kyle P
Home Financials for this Owner
Home Financials are based on the most recent Mortgage that was taken out on this home.
Original Mortgage
$256,000
Interest Rate
6.08%
Mortgage Type
Purchase Money Mortgage
Purchase Details
Closed on
Nov 27, 2002
Sold by
Denney Francis A
Bought by
Denney Francis A and Denney Patricia
Home Financials for this Owner
Home Financials are based on the most recent Mortgage that was taken out on this home.
Original Mortgage
$182,000
Interest Rate
6.05%
Purchase Details
Closed on
Nov 7, 1997
Sold by
Joseph Coopersmith
Bought by
Denney Francis A
Home Financials for this Owner
Home Financials are based on the most recent Mortgage that was taken out on this home.
Original Mortgage
$132,107
Interest Rate
7.28%
Mortgage Type
FHA
Create a Home Valuation Report for This Property
The Home Valuation Report is an in-depth analysis detailing your home's value as well as a comparison with similar homes in the area
Home Values in the Area
Average Home Value in this Area
Purchase History
| Date | Buyer | Sale Price | Title Company |
|---|---|---|---|
| Jackson John H | $314,840 | Land Title Guarantee Company | |
| Seedorf Erin J | $320,000 | Land Title | |
| Denney Francis A | -- | -- | |
| Denney Francis A | $138,000 | -- |
Source: Public Records
Mortgage History
| Date | Status | Borrower | Loan Amount |
|---|---|---|---|
| Previous Owner | Seedorf Erin J | $256,000 | |
| Previous Owner | Denney Francis A | $182,000 | |
| Previous Owner | Denney Francis A | $132,107 |
Source: Public Records
Tax History Compared to Growth
Tax History
| Year | Tax Paid | Tax Assessment Tax Assessment Total Assessment is a certain percentage of the fair market value that is determined by local assessors to be the total taxable value of land and additions on the property. | Land | Improvement |
|---|---|---|---|---|
| 2024 | $3,345 | $48,930 | $11,180 | $37,750 |
| 2023 | $3,272 | $48,930 | $11,180 | $37,750 |
| 2022 | $2,321 | $36,130 | $15,420 | $20,710 |
| 2021 | $2,241 | $37,180 | $15,870 | $21,310 |
| 2020 | $2,065 | $34,980 | $15,870 | $19,110 |
| 2019 | $2,007 | $34,980 | $15,870 | $19,110 |
| 2018 | $1,899 | $31,750 | $15,980 | $15,770 |
| 2017 | $2,449 | $31,750 | $15,980 | $15,770 |
| 2016 | $2,446 | $30,000 | $13,946 | $16,054 |
| 2015 | $2,344 | $30,000 | $13,946 | $16,054 |
| 2014 | $2,076 | $24,990 | $7,164 | $17,826 |
Source: Public Records
Map
Nearby Homes
- 3320 S Fulton Ct
- 3309 S Galena Ct
- 3158 S Dayton Ct
- 3062 S Florence Ct
- 3404 S Clinton Ct
- 9424 E Girard Ave
- 9230 E Girard Ave Unit 7
- 9440 E Girard Ave Unit 1
- 2770 S Elmira St Unit 157
- 2777 S Elmira St Unit 10
- 10000 E Yale Ave Unit 55
- 10000 E Yale Ave Unit 57
- 10000 E Yale Ave Unit 58
- 10000 E Yale Ave Unit 41
- 9004 E Floyd Ave
- 2685 S Dayton Way Unit 282
- 2685 S Dayton Way Unit 141
- 2685 S Dayton Way Unit 105
- 2685 S Dayton Way Unit 273
- 2685 S Dayton Way Unit 81
- 3395 S Elmira Ct
- 3393 S Florence Ct
- 3373 S Florence Ct
- 3364 S Elmira Ct
- 3385 S Elmira Ct
- 3375 S Elmira Ct
- 3353 S Florence Ct
- 3344 S Elmira Ct
- 3355 S Elmira Ct
- 3333 S Florence Ct
- 3386 S Emporia Ct
- 3382 S Florence Ct
- 3362 S Florence Ct
- 3324 S Elmira Ct
- 3366 S Emporia Ct
- 3335 S Elmira Ct
- 3342 S Florence Ct
- 3396 S Emporia Ct
- 3346 S Emporia Ct
- 3313 S Florence Ct