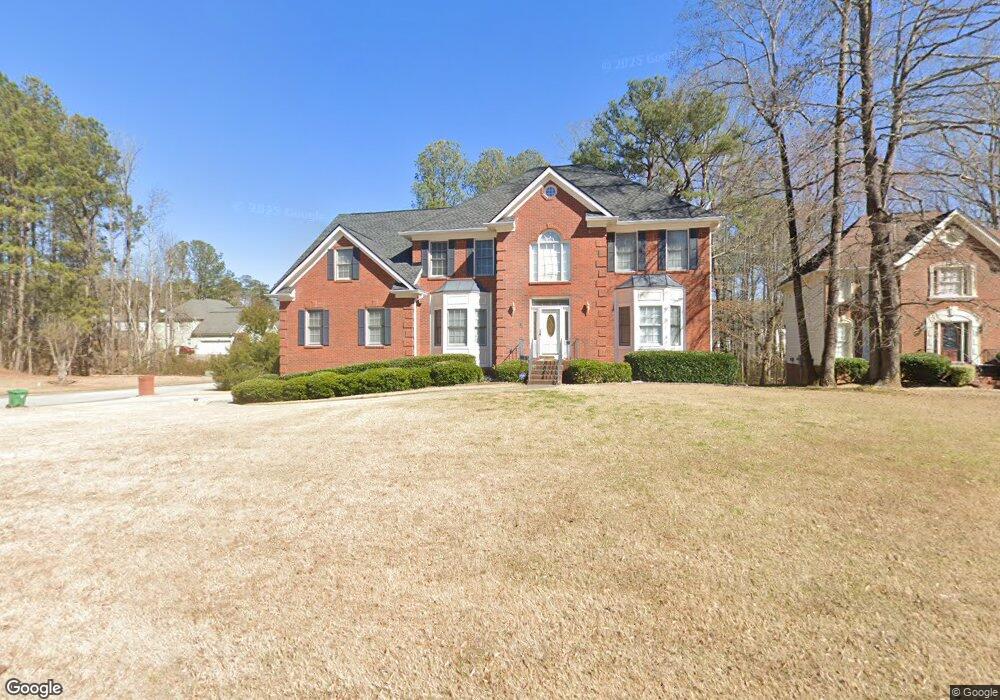
3398 Lakeview Landing Lithonia, GA 30038
Estimated Value: $403,234 - $463,000
4
Beds
3
Baths
3,608
Sq Ft
$118/Sq Ft
Est. Value
About This Home
This home is located at 3398 Lakeview Landing, Lithonia, GA 30038 and is currently estimated at $426,309, approximately $118 per square foot. 3398 Lakeview Landing is a home located in DeKalb County with nearby schools including Flat Rock Elementary School, Lithonia Middle School, and Lithonia High School.
Ownership History
Date
Name
Owned For
Owner Type
Purchase Details
Closed on
Jul 14, 2020
Sold by
Huntley Andrew
Bought by
Huntley Juanita
Current Estimated Value
Purchase Details
Closed on
May 20, 1998
Sold by
Ta Investments Inc
Bought by
Huntley Juanita and Huntley Andrew
Home Financials for this Owner
Home Financials are based on the most recent Mortgage that was taken out on this home.
Original Mortgage
$197,100
Interest Rate
10.75%
Mortgage Type
New Conventional
Purchase Details
Closed on
Oct 31, 1997
Sold by
Jsa Enterprises Inc
Bought by
Ta Investments Inc
Create a Home Valuation Report for This Property
The Home Valuation Report is an in-depth analysis detailing your home's value as well as a comparison with similar homes in the area
Home Values in the Area
Average Home Value in this Area
Purchase History
| Date | Buyer | Sale Price | Title Company |
|---|---|---|---|
| Huntley Juanita | -- | -- | |
| Huntley Juanita | $219,000 | -- | |
| Ta Investments Inc | $25,000 | -- |
Source: Public Records
Mortgage History
| Date | Status | Borrower | Loan Amount |
|---|---|---|---|
| Previous Owner | Huntley Juanita | $197,100 |
Source: Public Records
Tax History Compared to Growth
Tax History
| Year | Tax Paid | Tax Assessment Tax Assessment Total Assessment is a certain percentage of the fair market value that is determined by local assessors to be the total taxable value of land and additions on the property. | Land | Improvement |
|---|---|---|---|---|
| 2025 | $5,305 | $173,120 | $28,520 | $144,600 |
| 2024 | $5,440 | $171,640 | $28,520 | $143,120 |
| 2023 | $5,440 | $163,360 | $28,520 | $134,840 |
| 2022 | $4,767 | $146,680 | $28,520 | $118,160 |
| 2021 | $4,532 | $133,000 | $28,520 | $104,480 |
| 2020 | $3,940 | $116,760 | $28,520 | $88,240 |
| 2019 | $3,821 | $112,120 | $28,520 | $83,600 |
| 2018 | $3,562 | $102,800 | $28,520 | $74,280 |
| 2017 | $3,852 | $108,920 | $28,520 | $80,400 |
| 2016 | $3,724 | $108,000 | $28,520 | $79,480 |
| 2014 | $3,416 | $100,000 | $28,440 | $71,560 |
Source: Public Records
Map
Nearby Homes
- 6061 Spring Way
- 5985 Spring Way
- 6055 Spring Way
- Lakewood Plan at Highland Park
- Swindon Plan at Highland Park
- Brookpark Plan at Highland Park
- Heron Cottage Plan at Highland Park
- Easton Plan at Highland Park
- Mallow Plan at Highland Park
- Inwood Plan at Highland Park
- Colehill Plan at Highland Park
- Lancaster Plan at Highland Park
- 6093 Ruby Falls
- 3003 Fairing Hill
- 3555 Wade Rd
- 2966 Fairton Trail
- 5964 Springfair Run
- 6400 Rockland Rd
- 3237 Fairington Dr
- 3211 Rockview Dr
- 3404 Lakeview Landing
- 0 Lakeview Landing
- 3579 Lakeview Landing Unit 253
- 6126 Lakeview Overlook
- 0 Lakeview Overlook Unit 3253847
- 0 Lakeview Overlook Unit 8164091
- 6116 Lakeview Overlook
- 6138 Lakeview Overlook
- 3408 Lakeview Landing
- 3408 Lakeview Landing Unit 68
- 3397 Lakeview Landing
- 6145 Lakeview Overlook
- 3403 Lakeview Landing
- 3397 Spring Lake Overlook
- 6148 Lakeview Overlook
- 3407 Lakeview Landing
- 6108 Lakeview Overlook
- 6099 Lakeview Overlook
- 3375 Spring Lake Overlook
- 0 Spring Lake Overlook Unit 9041854