33R Elm St Bellingham, MA 02019
Estimated Value: $492,000 - $533,058
3
Beds
3
Baths
1,764
Sq Ft
$294/Sq Ft
Est. Value
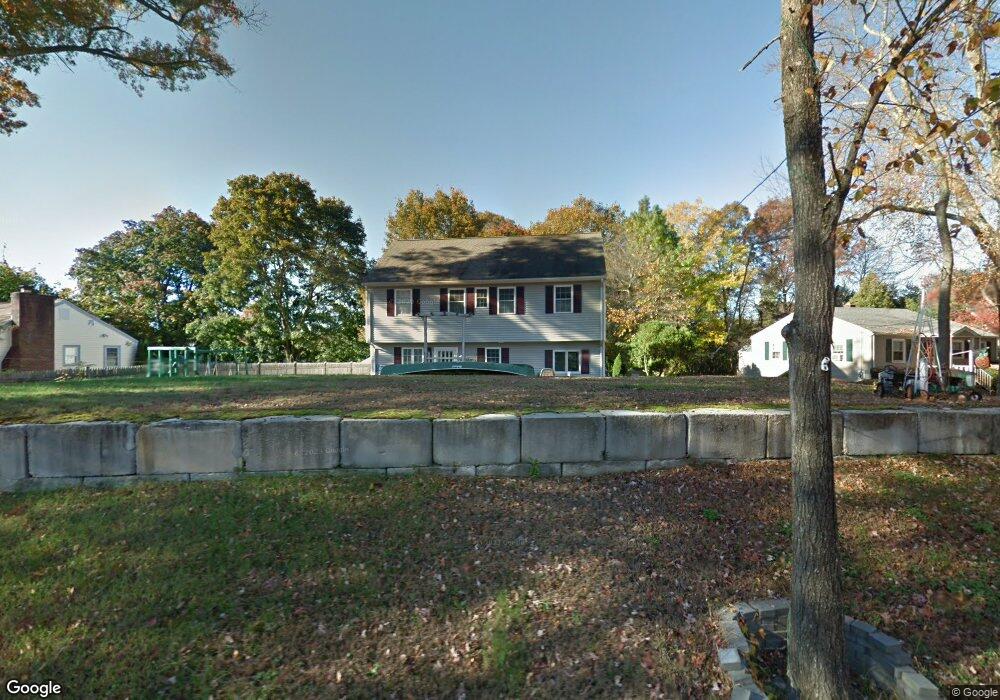
About This Home
This home is located at 33R Elm St, Bellingham, MA 02019 and is currently estimated at $519,265, approximately $294 per square foot. 33R Elm St is a home located in Norfolk County with nearby schools including Joseph F. DiPietro Elementary, Bellingham High School, and Rise Prep Mayoral Academy Middle School.
Ownership History
Date
Name
Owned For
Owner Type
Purchase Details
Closed on
Aug 5, 2015
Sold by
Choiniere Steven D and Choiniere Nicole D
Bought by
Choiniere Nicole D
Current Estimated Value
Purchase Details
Closed on
Jan 23, 2009
Sold by
Choiniere Steven D and Choiniere Cheryl A
Bought by
Choinirere Steven D and Choinirere Nicole D
Purchase Details
Closed on
May 7, 2007
Sold by
Choiniere Steven D
Bought by
Choiniere Cheryl A and Choiniere Steven D
Purchase Details
Closed on
Mar 30, 2006
Sold by
Choiniere Steven D
Bought by
Choiniere Steven D
Create a Home Valuation Report for This Property
The Home Valuation Report is an in-depth analysis detailing your home's value as well as a comparison with similar homes in the area
Home Values in the Area
Average Home Value in this Area
Purchase History
| Date | Buyer | Sale Price | Title Company |
|---|---|---|---|
| Choiniere Nicole D | -- | -- | |
| Choinirere Steven D | -- | -- | |
| Choiniere Cheryl A | -- | -- | |
| Choiniere Steven D | -- | -- |
Source: Public Records
Tax History Compared to Growth
Tax History
| Year | Tax Paid | Tax Assessment Tax Assessment Total Assessment is a certain percentage of the fair market value that is determined by local assessors to be the total taxable value of land and additions on the property. | Land | Improvement |
|---|---|---|---|---|
| 2025 | $5,128 | $408,300 | $130,200 | $278,100 |
| 2024 | $4,886 | $379,900 | $118,900 | $261,000 |
| 2023 | $4,707 | $360,700 | $113,200 | $247,500 |
| 2022 | $4,631 | $328,900 | $94,400 | $234,500 |
| 2021 | $4,470 | $310,200 | $94,400 | $215,800 |
| 2020 | $4,211 | $296,100 | $94,400 | $201,700 |
| 2019 | $4,117 | $289,700 | $94,400 | $195,300 |
| 2018 | $3,891 | $270,000 | $95,300 | $174,700 |
| 2017 | $3,773 | $263,100 | $95,300 | $167,800 |
| 2016 | $4,010 | $280,600 | $99,100 | $181,500 |
| 2015 | $3,845 | $269,800 | $95,300 | $174,500 |
| 2014 | $3,839 | $261,900 | $91,900 | $170,000 |
Source: Public Records
Map
Nearby Homes