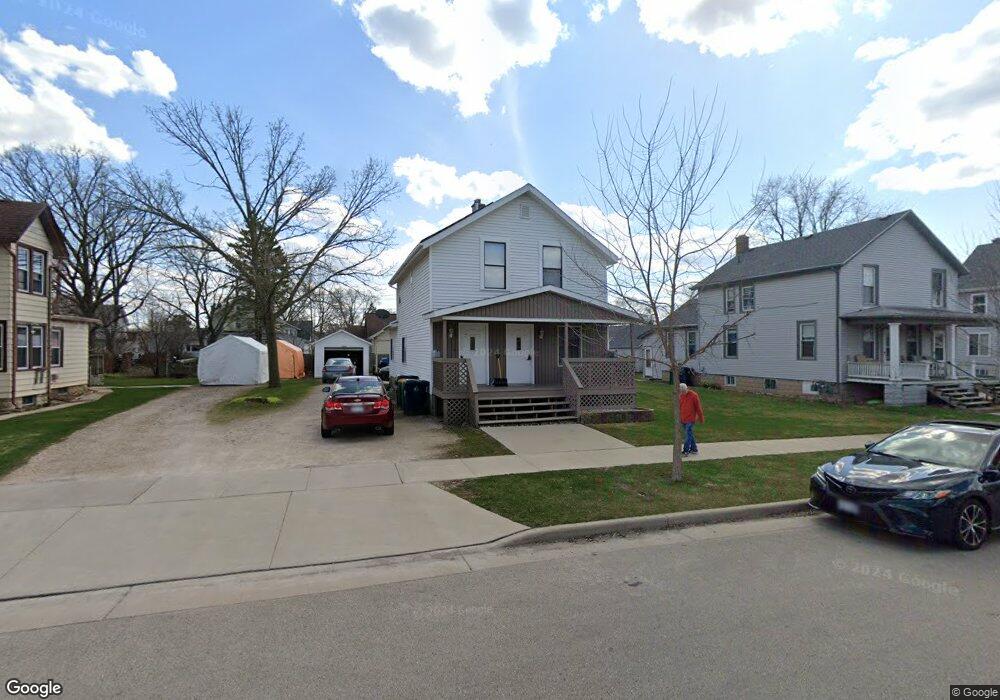
34 7th St Unit Furnished Upper Unit Fond Du Lac, WI 54935
Estimated Value: $149,000 - $174,000
2
Beds
2
Baths
666
Sq Ft
$242/Sq Ft
Est. Value
About This Home
Travel nurse special*
Come enjoy this newly renovated and totally furnished upper or lower unit featuring a dishwasher, in house washer and dryer, hardwood floors, and a full back yard.
Both bedrooms feature a full size bed. Full size couch that does recline on both ends in living room.
Ownership History
Date
Name
Owned For
Owner Type
Purchase Details
Closed on
Aug 10, 2021
Sold by
Second Fondy Duplex Llc
Bought by
Rihn Logan
Current Estimated Value
Home Financials for this Owner
Home Financials are based on the most recent Mortgage that was taken out on this home.
Original Mortgage
$98,188
Outstanding Balance
$89,283
Interest Rate
2.9%
Mortgage Type
FHA
Estimated Equity
$72,192
Purchase Details
Closed on
Apr 20, 2017
Sold by
Becker Daniel I and Gudex Daine J
Bought by
Second Fondy Duplex Llc
Create a Home Valuation Report for This Property
The Home Valuation Report is an in-depth analysis detailing your home's value as well as a comparison with similar homes in the area
Home Values in the Area
Average Home Value in this Area
Purchase History
| Date | Buyer | Sale Price | Title Company |
|---|---|---|---|
| Rihn Logan | $100,000 | Gowey Abstract & Ttl Co Inc | |
| Second Fondy Duplex Llc | $85,000 | None Available |
Source: Public Records
Mortgage History
| Date | Status | Borrower | Loan Amount |
|---|---|---|---|
| Open | Rihn Logan | $98,188 |
Source: Public Records
Property History
| Date | Event | Price | List to Sale | Price per Sq Ft |
|---|---|---|---|---|
| 05/05/2025 05/05/25 | Off Market | $1,400 | -- | -- |
| 04/02/2025 04/02/25 | For Rent | $1,400 | 0.0% | -- |
| 04/02/2025 04/02/25 | Price Changed | $1,400 | -12.5% | $2 / Sq Ft |
| 12/25/2024 12/25/24 | Off Market | $1,600 | -- | -- |
| 11/19/2024 11/19/24 | For Rent | $1,600 | -- | -- |
Tax History Compared to Growth
Tax History
| Year | Tax Paid | Tax Assessment Tax Assessment Total Assessment is a certain percentage of the fair market value that is determined by local assessors to be the total taxable value of land and additions on the property. | Land | Improvement |
|---|---|---|---|---|
| 2024 | $2,190 | $83,000 | $18,300 | $64,700 |
| 2023 | $2,146 | $83,000 | $18,300 | $64,700 |
| 2022 | $2,026 | $83,000 | $18,300 | $64,700 |
| 2021 | $2,032 | $83,000 | $18,300 | $64,700 |
| 2020 | $2,026 | $83,000 | $18,300 | $64,700 |
| 2019 | $2,024 | $83,000 | $18,300 | $64,700 |
| 2018 | $2,789 | $82,500 | $18,300 | $64,200 |
| 2017 | $2,100 | $82,500 | $18,300 | $64,200 |
| 2016 | $1,985 | $77,500 | $18,300 | $59,200 |
| 2015 | $2,419 | $77,500 | $18,300 | $59,200 |
| 2014 | $1,842 | $77,500 | $18,300 | $59,200 |
| 2013 | $1,907 | $79,700 | $20,400 | $59,300 |
Source: Public Records
Map
Nearby Homes