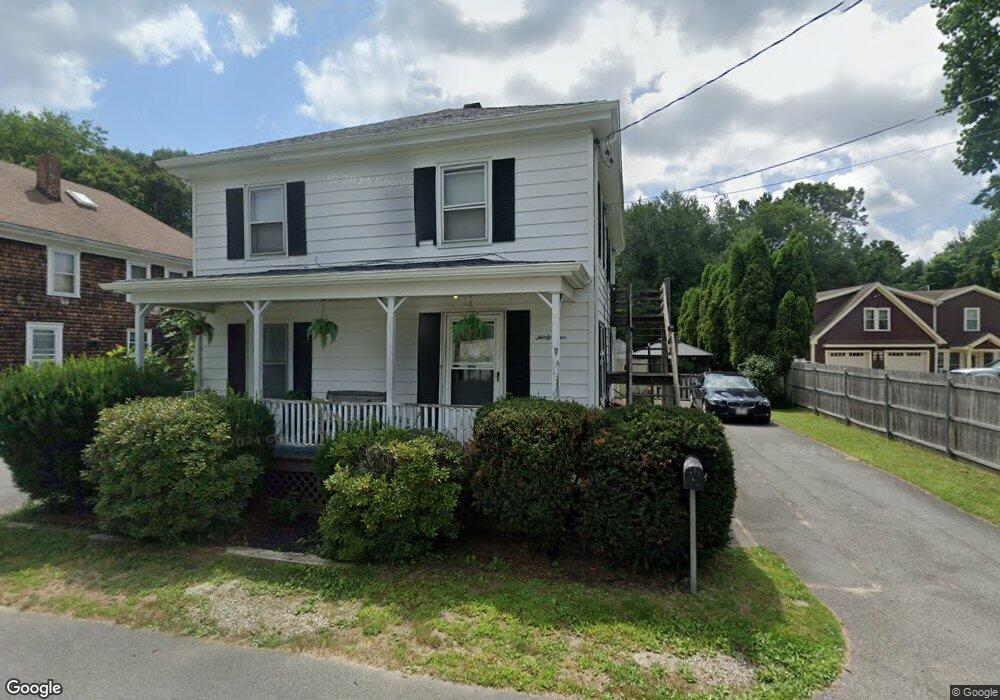
34 Bardsley St Acushnet, MA 02743
Estimated Value: $444,000 - $471,000
4
Beds
1
Bath
2,144
Sq Ft
$215/Sq Ft
Est. Value
About This Home
This home is located at 34 Bardsley St, Acushnet, MA 02743 and is currently estimated at $460,520, approximately $214 per square foot. 34 Bardsley St is a home located in Bristol County with nearby schools including Acushnet Elementary School, Albert F Ford Middle School, and Alma Del Mar Charter School.
Ownership History
Date
Name
Owned For
Owner Type
Purchase Details
Closed on
Aug 20, 2004
Sold by
Ne Res Svcs
Bought by
Harbick 3Rd Robert L and Harbick Sandra L
Current Estimated Value
Home Financials for this Owner
Home Financials are based on the most recent Mortgage that was taken out on this home.
Original Mortgage
$223,000
Outstanding Balance
$110,803
Interest Rate
6.03%
Mortgage Type
Purchase Money Mortgage
Estimated Equity
$349,717
Purchase Details
Closed on
Nov 6, 1989
Sold by
Kasmire Francis L
Bought by
New Eng Residential
Create a Home Valuation Report for This Property
The Home Valuation Report is an in-depth analysis detailing your home's value as well as a comparison with similar homes in the area
Home Values in the Area
Average Home Value in this Area
Purchase History
| Date | Buyer | Sale Price | Title Company |
|---|---|---|---|
| Harbick 3Rd Robert L | $223,000 | -- | |
| New Eng Residential | $180,000 | -- |
Source: Public Records
Mortgage History
| Date | Status | Borrower | Loan Amount |
|---|---|---|---|
| Open | New Eng Residential | $223,000 | |
| Previous Owner | New Eng Residential | $81,750 | |
| Previous Owner | New Eng Residential | $70,000 | |
| Previous Owner | New Eng Residential | $70,000 |
Source: Public Records
Tax History
| Year | Tax Paid | Tax Assessment Tax Assessment Total Assessment is a certain percentage of the fair market value that is determined by local assessors to be the total taxable value of land and additions on the property. | Land | Improvement |
|---|---|---|---|---|
| 2025 | $36 | $335,400 | $95,300 | $240,100 |
| 2024 | $3,672 | $321,800 | $91,200 | $230,600 |
| 2023 | $3,450 | $287,500 | $82,900 | $204,600 |
| 2022 | $3,523 | $265,500 | $78,800 | $186,700 |
| 2021 | $3,192 | $230,800 | $78,800 | $152,000 |
| 2020 | $3,217 | $230,800 | $78,800 | $152,000 |
| 2019 | $3,083 | $217,400 | $78,800 | $138,600 |
| 2018 | $2,985 | $207,000 | $78,800 | $128,200 |
| 2017 | $2,884 | $199,700 | $78,800 | $120,900 |
| 2016 | $2,727 | $187,700 | $78,800 | $108,900 |
| 2015 | $2,680 | $187,700 | $78,800 | $108,900 |
Source: Public Records
Map
Nearby Homes
- 0 Hathaway Rd Unit 73469544
- 14 Hayes St Unit 1
- 12 Hayes St Unit 1
- 12 White St
- 11 Boylston St
- 41 Jean St
- 91 S Main St
- 23 Oliveira Ave
- 112 Lawson Ave
- 122 Truro St
- 20 Jake Ln
- 4 Sam St
- 81 Sylvia St
- 25 Pershing Ave
- 5 William St
- 44 Bernard St
- 191 Hathaway Rd
- 1940-1942 Acushnet Ave
- 34 Chicopee St
- 363 Main St
Your Personal Tour Guide
Ask me questions while you tour the home.