Estimated Value: $297,000 - $355,185
2
Beds
2
Baths
1,084
Sq Ft
$302/Sq Ft
Est. Value
About This Home
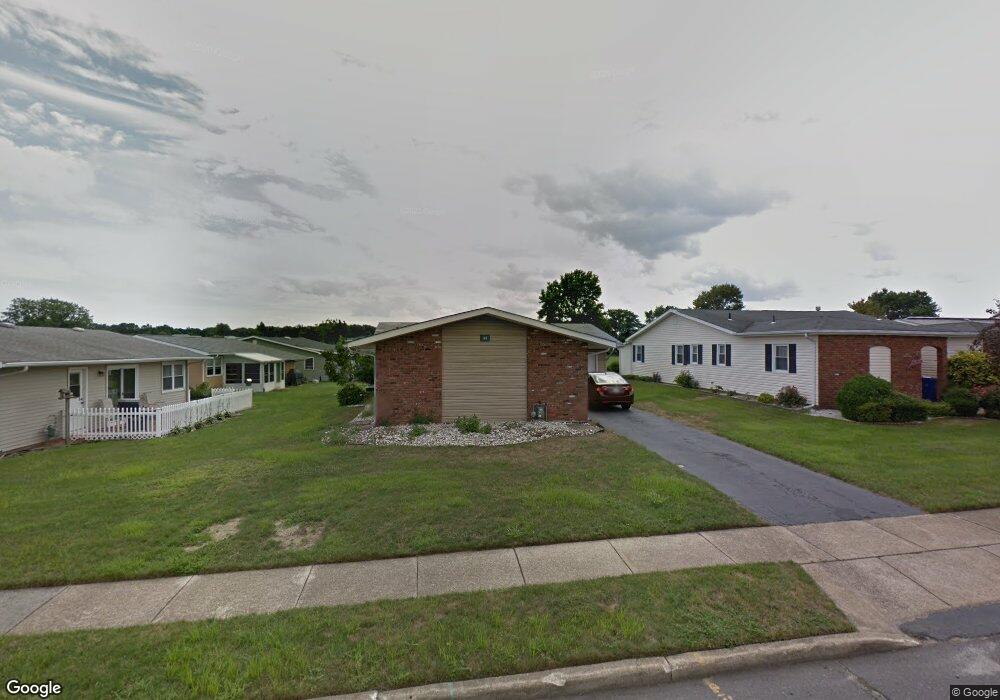
This home is located at 34 Barker St, Brick, NJ 08724 and is currently estimated at $327,296, approximately $301 per square foot. 34 Barker St is a home located in Ocean County with nearby schools including Lanes Mill Elementary School, Veterans Memorial Middle School, and Brick Township Memorial High School.
Ownership History
Date
Name
Owned For
Owner Type
Purchase Details
Closed on
Apr 13, 2012
Sold by
Fannie Mae
Bought by
Romagnano Mary Rose
Current Estimated Value
Home Financials for this Owner
Home Financials are based on the most recent Mortgage that was taken out on this home.
Original Mortgage
$146,850
Outstanding Balance
$101,431
Interest Rate
3.91%
Mortgage Type
Reverse Mortgage Home Equity Conversion Mortgage
Estimated Equity
$225,865
Purchase Details
Closed on
Dec 29, 2011
Sold by
Digironimo Ben and Di Gironimo Barbara
Bought by
Federal National Mortgage Association
Purchase Details
Closed on
Aug 23, 1995
Sold by
Mattie Joseph
Bought by
Digironimo Ben and Di Gironimo Barbara
Home Financials for this Owner
Home Financials are based on the most recent Mortgage that was taken out on this home.
Original Mortgage
$72,000
Interest Rate
7.32%
Create a Home Valuation Report for This Property
The Home Valuation Report is an in-depth analysis detailing your home's value as well as a comparison with similar homes in the area
Home Values in the Area
Average Home Value in this Area
Purchase History
| Date | Buyer | Sale Price | Title Company |
|---|---|---|---|
| Romagnano Mary Rose | $97,900 | Counsellors Title Agency Inc | |
| Federal National Mortgage Association | -- | None Available | |
| Digironimo Ben | $76,000 | -- |
Source: Public Records
Mortgage History
| Date | Status | Borrower | Loan Amount |
|---|---|---|---|
| Open | Romagnano Mary Rose | $146,850 | |
| Previous Owner | Digironimo Ben | $72,000 |
Source: Public Records
Tax History
| Year | Tax Paid | Tax Assessment Tax Assessment Total Assessment is a certain percentage of the fair market value that is determined by local assessors to be the total taxable value of land and additions on the property. | Land | Improvement |
|---|---|---|---|---|
| 2025 | $2,829 | $108,400 | $40,000 | $68,400 |
| 2024 | $2,685 | $108,400 | $40,000 | $68,400 |
Source: Public Records
Map
Nearby Homes
Your Personal Tour Guide
Ask me questions while you tour the home.