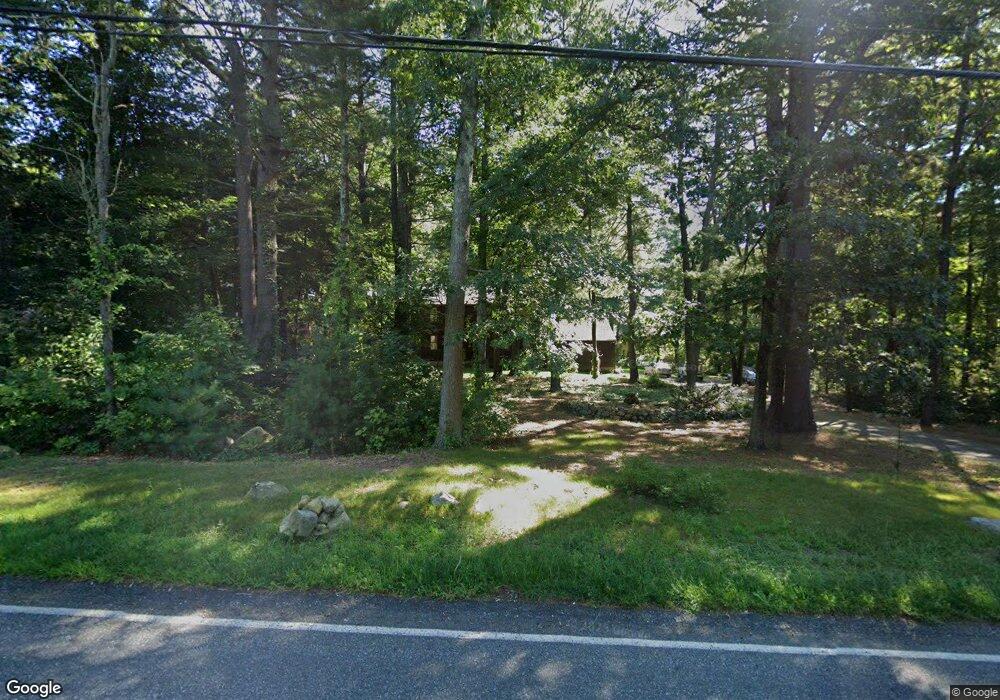
34 Bates St Mendon, MA 01756
Estimated Value: $578,000 - $615,000
4
Beds
3
Baths
1,800
Sq Ft
$334/Sq Ft
Est. Value
About This Home
This home is located at 34 Bates St, Mendon, MA 01756 and is currently estimated at $600,688, approximately $333 per square foot. 34 Bates St is a home located in Worcester County with nearby schools including Nipmuc Regional High School, Bethany Christian Academy, and Mendon Mennonite School.
Ownership History
Date
Name
Owned For
Owner Type
Purchase Details
Closed on
Jan 28, 2025
Sold by
Alexanian Souren
Bought by
Souren Alexanian T and Souren Alexanian
Current Estimated Value
Purchase Details
Closed on
Apr 24, 1980
Bought by
Alexanian Souren and Alexanian Jolene Marie
Create a Home Valuation Report for This Property
The Home Valuation Report is an in-depth analysis detailing your home's value as well as a comparison with similar homes in the area
Home Values in the Area
Average Home Value in this Area
Purchase History
| Date | Buyer | Sale Price | Title Company |
|---|---|---|---|
| Souren Alexanian T | -- | None Available | |
| Souren Alexanian T | -- | None Available | |
| Alexanian Souren | -- | -- |
Source: Public Records
Mortgage History
| Date | Status | Borrower | Loan Amount |
|---|---|---|---|
| Previous Owner | Alexanian Souren | $132,000 | |
| Previous Owner | Alexanian Souren | $133,000 | |
| Previous Owner | Alexanian Souren | $150,000 |
Source: Public Records
Tax History
| Year | Tax Paid | Tax Assessment Tax Assessment Total Assessment is a certain percentage of the fair market value that is determined by local assessors to be the total taxable value of land and additions on the property. | Land | Improvement |
|---|---|---|---|---|
| 2025 | $6,924 | $517,100 | $173,500 | $343,600 |
| 2024 | $6,865 | $500,700 | $166,800 | $333,900 |
| 2023 | $6,818 | $467,000 | $148,800 | $318,200 |
| 2022 | $6,746 | $437,800 | $148,800 | $289,000 |
| 2021 | $6,489 | $386,500 | $144,300 | $242,200 |
| 2020 | $6,079 | $362,900 | $138,300 | $224,600 |
| 2019 | $5,837 | $348,700 | $128,500 | $220,200 |
| 2018 | $5,665 | $334,000 | $128,500 | $205,500 |
| 2017 | $5,671 | $319,500 | $128,500 | $191,000 |
| 2016 | $5,537 | $321,000 | $130,200 | $190,800 |
| 2015 | $5,078 | $317,200 | $130,200 | $187,000 |
| 2014 | $4,944 | $308,600 | $132,100 | $176,500 |
Source: Public Records
Map
Nearby Homes
- 4 Carby Dr
- 123-125 Mendon St
- 0 Hartford Ave
- 370 S Main St
- 23 Bellwood Cir Unit 23
- 1 Evergreen Dr Unit 1
- 34 Bellwood Cir Unit 34
- 50 Hartford Ave E
- 48 Donna Rd
- 60 Wethersfield Rd
- 8 Puffer Dr
- 31 Cemetery St
- 67 Jeannine Rd
- 111 Providence St
- 267 R S Main St
- 267 F S Main St
- 23 Bens Way
- 279 S Main St
- 19 Bens Way
- 25 Bens Way
Your Personal Tour Guide
Ask me questions while you tour the home.