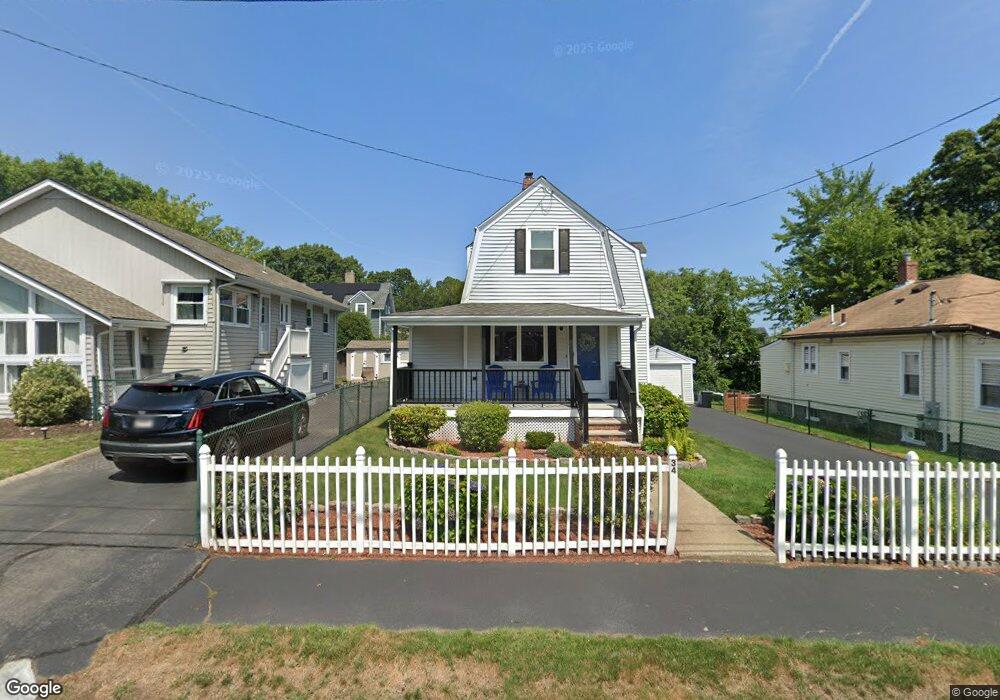
34 Bittern Rd Quincy, MA 02169
Adams Shore NeighborhoodEstimated Value: $678,000 - $794,000
2
Beds
1
Bath
1,096
Sq Ft
$659/Sq Ft
Est. Value
About This Home
This home is located at 34 Bittern Rd, Quincy, MA 02169 and is currently estimated at $722,103, approximately $658 per square foot. 34 Bittern Rd is a home located in Norfolk County with nearby schools including Merrymount Elementary School, Broad Meadows Middle School, and Quincy High School.
Ownership History
Date
Name
Owned For
Owner Type
Purchase Details
Closed on
May 6, 2002
Sold by
Davis James H
Bought by
Gardner Cheryl
Current Estimated Value
Home Financials for this Owner
Home Financials are based on the most recent Mortgage that was taken out on this home.
Original Mortgage
$150,000
Outstanding Balance
$64,230
Interest Rate
7.13%
Mortgage Type
Purchase Money Mortgage
Estimated Equity
$657,873
Purchase Details
Closed on
Jul 11, 2001
Sold by
Wells Fargo Bk Minn Na
Bought by
Davis James H
Home Financials for this Owner
Home Financials are based on the most recent Mortgage that was taken out on this home.
Original Mortgage
$159,300
Interest Rate
7.2%
Purchase Details
Closed on
Jan 25, 2001
Sold by
Est Robertson Warren
Bought by
Norwest Bk Minn Na Tr
Purchase Details
Closed on
Sep 10, 1991
Sold by
Tully Exr Beverly
Bought by
Robertson Warren and Robertson Joan
Create a Home Valuation Report for This Property
The Home Valuation Report is an in-depth analysis detailing your home's value as well as a comparison with similar homes in the area
Home Values in the Area
Average Home Value in this Area
Purchase History
| Date | Buyer | Sale Price | Title Company |
|---|---|---|---|
| Gardner Cheryl | $332,500 | -- | |
| Davis James H | $177,000 | -- | |
| Norwest Bk Minn Na Tr | $150,000 | -- | |
| Robertson Warren | $80,000 | -- |
Source: Public Records
Mortgage History
| Date | Status | Borrower | Loan Amount |
|---|---|---|---|
| Open | Gardner Cheryl | $150,000 | |
| Previous Owner | Robertson Warren | $159,300 | |
| Previous Owner | Robertson Warren | $159,300 |
Source: Public Records
Tax History
| Year | Tax Paid | Tax Assessment Tax Assessment Total Assessment is a certain percentage of the fair market value that is determined by local assessors to be the total taxable value of land and additions on the property. | Land | Improvement |
|---|---|---|---|---|
| 2025 | $6,941 | $602,000 | $279,500 | $322,500 |
| 2024 | $6,390 | $567,000 | $271,300 | $295,700 |
| 2023 | $5,744 | $516,100 | $235,900 | $280,200 |
| 2022 | $5,923 | $494,400 | $214,500 | $279,900 |
| 2021 | $5,622 | $463,100 | $214,500 | $248,600 |
| 2020 | $5,408 | $435,100 | $206,200 | $228,900 |
| 2019 | $5,238 | $417,400 | $192,700 | $224,700 |
| 2018 | $4,950 | $371,100 | $167,600 | $203,500 |
| 2017 | $5,052 | $356,500 | $167,600 | $188,900 |
| 2016 | $4,928 | $343,200 | $167,600 | $175,600 |
| 2015 | $4,660 | $319,200 | $158,100 | $161,100 |
| 2014 | $4,393 | $295,600 | $150,600 | $145,000 |
Source: Public Records
Map
Nearby Homes
- 59 Terne Rd
- 479 Sea St Unit 2
- 9 Poplar Rd
- 11 Riverside Ave
- 599 Sea St Unit 2
- 599 Sea St Unit 1
- 96 Utica St
- 245 Sea St Unit 45
- 162 Palmer St
- 10 Forbush Ave
- 40 Virginia Rd
- 33 Virginia Rd
- 105 Sea St Unit 105
- 105 Sea St Unit 102
- 51 Stoughton St
- 200 Cove Way Unit 1004
- 18 Allerton St
- 107 Baxter Ave
- 50 Harrison St
- 148 Furnace Brook Pkwy
Your Personal Tour Guide
Ask me questions while you tour the home.