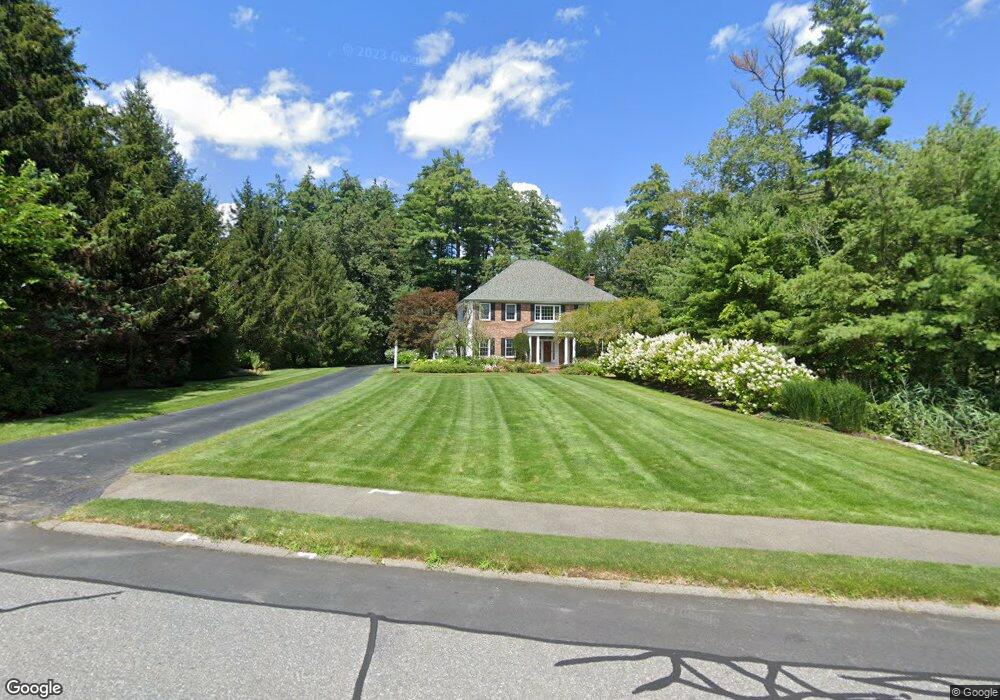
34 Briant Dr Sudbury, MA 01776
Estimated Value: $1,722,843 - $1,878,000
4
Beds
5
Baths
3,668
Sq Ft
$493/Sq Ft
Est. Value
About This Home
This home is located at 34 Briant Dr, Sudbury, MA 01776 and is currently estimated at $1,809,211, approximately $493 per square foot. 34 Briant Dr is a home located in Middlesex County with nearby schools including General John Nixon Elementary School, Ephraim Curtis Middle School, and Lincoln-Sudbury Regional High School.
Ownership History
Date
Name
Owned For
Owner Type
Purchase Details
Closed on
May 28, 2021
Sold by
Gaiter Andrea
Bought by
Gaiter Andrea and Wicker Scott
Current Estimated Value
Home Financials for this Owner
Home Financials are based on the most recent Mortgage that was taken out on this home.
Original Mortgage
$601,000
Outstanding Balance
$544,131
Interest Rate
2.9%
Mortgage Type
New Conventional
Estimated Equity
$1,265,080
Purchase Details
Closed on
Dec 2, 2013
Sold by
Wicker Scott and Gaiter Andrea
Bought by
Gaiter Andrea
Purchase Details
Closed on
Apr 30, 2003
Sold by
Relocation Dynamics In
Bought by
Galter Andrea and Wicker Scott
Purchase Details
Closed on
Feb 14, 1997
Sold by
Maillet & Son Inc
Bought by
Wildman Daniel G and Wildman Pamela J
Create a Home Valuation Report for This Property
The Home Valuation Report is an in-depth analysis detailing your home's value as well as a comparison with similar homes in the area
Home Values in the Area
Average Home Value in this Area
Purchase History
| Date | Buyer | Sale Price | Title Company |
|---|---|---|---|
| Gaiter Andrea | -- | None Available | |
| Gaiter Andrea | -- | None Available | |
| Gaiter Andrea | -- | None Available | |
| Gaiter Andrea | -- | -- | |
| Galter Andrea | $1,070,000 | -- | |
| Relocation Dynamics In | $1,070,000 | -- | |
| Wildman Daniel G | $650,000 | -- | |
| Gaiter Andrea | -- | -- | |
| Relocation Dynamics In | $1,070,000 | -- | |
| Wildman Daniel G | $650,000 | -- |
Source: Public Records
Mortgage History
| Date | Status | Borrower | Loan Amount |
|---|---|---|---|
| Open | Gaiter Andrea | $601,000 | |
| Closed | Gaiter Andrea | $601,000 | |
| Previous Owner | Wildman Daniel G | $713,000 | |
| Previous Owner | Wildman Daniel G | $201,300 |
Source: Public Records
Tax History Compared to Growth
Tax History
| Year | Tax Paid | Tax Assessment Tax Assessment Total Assessment is a certain percentage of the fair market value that is determined by local assessors to be the total taxable value of land and additions on the property. | Land | Improvement |
|---|---|---|---|---|
| 2025 | $25,131 | $1,716,600 | $530,700 | $1,185,900 |
| 2024 | $24,169 | $1,654,300 | $515,400 | $1,138,900 |
| 2023 | $22,682 | $1,438,300 | $481,800 | $956,500 |
| 2022 | $21,227 | $1,176,000 | $408,000 | $768,000 |
| 2021 | $8,567 | $1,094,500 | $408,000 | $686,500 |
| 2020 | $20,614 | $1,117,300 | $430,800 | $686,500 |
| 2019 | $20,011 | $1,117,300 | $430,800 | $686,500 |
| 2018 | $7,115 | $1,070,900 | $442,000 | $628,900 |
| 2017 | $18,352 | $1,034,500 | $411,400 | $623,100 |
| 2016 | $17,522 | $984,400 | $395,400 | $589,000 |
| 2015 | $17,392 | $988,200 | $410,400 | $577,800 |
| 2014 | $17,401 | $965,100 | $398,500 | $566,600 |
Source: Public Records
Map
Nearby Homes
- 5 Taintor Dr
- 55 Widow Rites Ln
- 45 Widow Rites Ln
- 54 Phillips Rd
- 166 Parker St Unit 4
- 12 Camperdown Ln
- 57 Longfellow Rd
- 4 Elderberry Cir
- 63 Canterbury Dr
- 47 Fairbank Rd
- 36 Old Forge Ln
- 250 Great Rd
- 589 North Rd
- 10 Oak Ridge Dr Unit 5
- 24 Goodnow Rd
- 5 Oak Ridge Dr Unit 7
- 67 Powder Mill Rd
- 16 Blacksmith Dr
- 42 Dakin Rd
- 11 Great Lake Dr