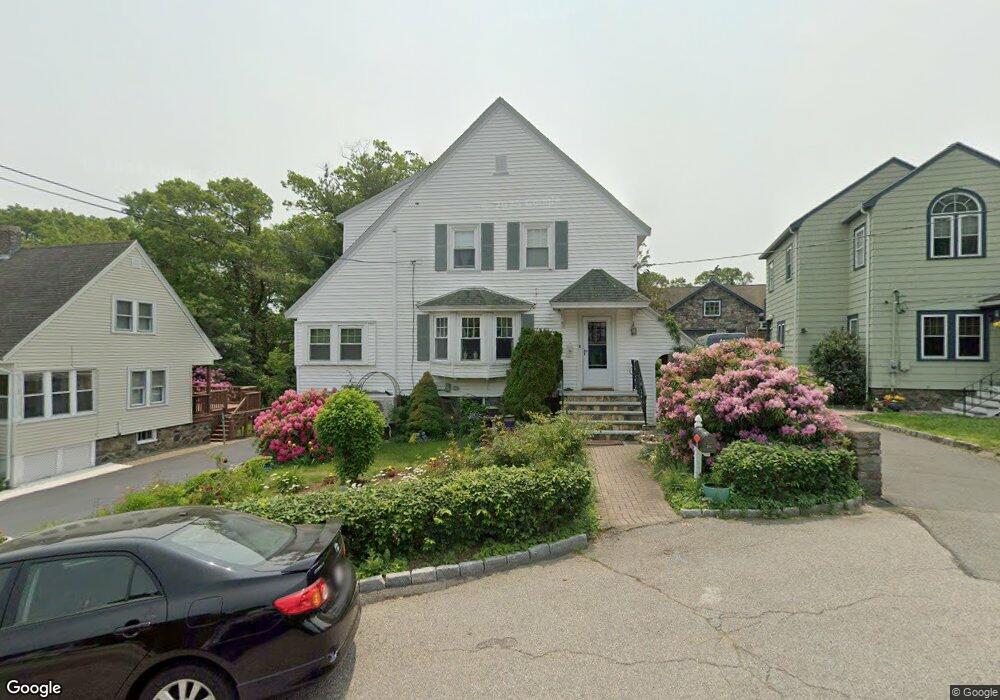
34 Buchanan Cir Lynn, MA 01902
Victory Road NeighborhoodEstimated Value: $590,000 - $639,000
3
Beds
1
Bath
1,339
Sq Ft
$453/Sq Ft
Est. Value
About This Home
This home is located at 34 Buchanan Cir, Lynn, MA 01902 and is currently estimated at $605,948, approximately $452 per square foot. 34 Buchanan Cir is a home located in Essex County with nearby schools including Aborn Elementary School, William R. Fallon School, and Pickering Middle School.
Ownership History
Date
Name
Owned For
Owner Type
Purchase Details
Closed on
May 17, 2023
Sold by
Dequina Joses B and Dofitas Erlinda D
Bought by
Buchanan Circle 2023 Ret
Current Estimated Value
Purchase Details
Closed on
Nov 17, 1992
Sold by
Hartman Rosne Pamela
Bought by
Dofitas Erlinda and Dequina Joses
Create a Home Valuation Report for This Property
The Home Valuation Report is an in-depth analysis detailing your home's value as well as a comparison with similar homes in the area
Home Values in the Area
Average Home Value in this Area
Purchase History
| Date | Buyer | Sale Price | Title Company |
|---|---|---|---|
| Buchanan Circle 2023 Ret | -- | None Available | |
| Buchanan Circle 2023 Ret | -- | None Available | |
| Buchanan Circle 2023 Ret | -- | None Available | |
| Dofitas Erlinda | $127,500 | -- | |
| Dofitas Erlinda | $127,500 | -- |
Source: Public Records
Mortgage History
| Date | Status | Borrower | Loan Amount |
|---|---|---|---|
| Previous Owner | Dofitas Erlinda | $170,000 | |
| Previous Owner | Dofitas Erlinda | $202,000 |
Source: Public Records
Tax History
| Year | Tax Paid | Tax Assessment Tax Assessment Total Assessment is a certain percentage of the fair market value that is determined by local assessors to be the total taxable value of land and additions on the property. | Land | Improvement |
|---|---|---|---|---|
| 2025 | $5,933 | $572,700 | $204,300 | $368,400 |
| 2024 | $5,658 | $537,300 | $205,200 | $332,100 |
| 2023 | $5,387 | $483,100 | $190,700 | $292,400 |
| 2022 | $5,499 | $442,400 | $181,100 | $261,300 |
| 2021 | $5,191 | $398,400 | $169,000 | $229,400 |
| 2020 | $4,816 | $359,400 | $139,600 | $219,800 |
| 2019 | $4,679 | $327,200 | $122,700 | $204,500 |
| 2018 | $4,734 | $312,500 | $133,800 | $178,700 |
| 2017 | $4,586 | $294,000 | $131,800 | $162,200 |
| 2016 | $4,362 | $269,600 | $116,900 | $152,700 |
| 2015 | $4,404 | $262,900 | $124,100 | $138,800 |
Source: Public Records
Map
Nearby Homes
Your Personal Tour Guide
Ask me questions while you tour the home.