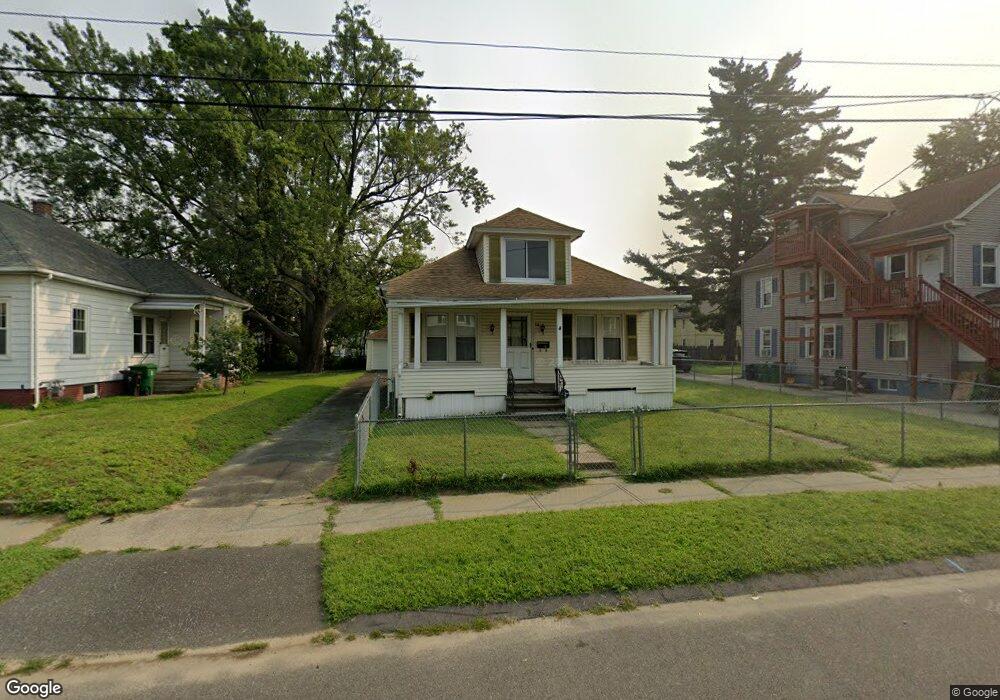
34 Call St Chicopee, MA 01013
Willimansett NeighborhoodEstimated Value: $268,000 - $279,000
2
Beds
1
Bath
1,078
Sq Ft
$254/Sq Ft
Est. Value
About This Home
This home is located at 34 Call St, Chicopee, MA 01013 and is currently estimated at $274,066, approximately $254 per square foot. 34 Call St is a home located in Hampden County with nearby schools including Fairview Elementary School, Bellamy Middle School, and Chicopee Comprehensive High School.
Ownership History
Date
Name
Owned For
Owner Type
Purchase Details
Closed on
Dec 30, 2011
Sold by
Fontaine Leonard V
Bought by
Worley Terrell
Current Estimated Value
Home Financials for this Owner
Home Financials are based on the most recent Mortgage that was taken out on this home.
Original Mortgage
$97,042
Outstanding Balance
$63,334
Interest Rate
3%
Mortgage Type
Purchase Money Mortgage
Estimated Equity
$210,732
Create a Home Valuation Report for This Property
The Home Valuation Report is an in-depth analysis detailing your home's value as well as a comparison with similar homes in the area
Home Values in the Area
Average Home Value in this Area
Purchase History
| Date | Buyer | Sale Price | Title Company |
|---|---|---|---|
| Worley Terrell | $95,000 | -- |
Source: Public Records
Mortgage History
| Date | Status | Borrower | Loan Amount |
|---|---|---|---|
| Open | Worley Terrell | $97,042 |
Source: Public Records
Tax History
| Year | Tax Paid | Tax Assessment Tax Assessment Total Assessment is a certain percentage of the fair market value that is determined by local assessors to be the total taxable value of land and additions on the property. | Land | Improvement |
|---|---|---|---|---|
| 2025 | $3,402 | $224,400 | $87,000 | $137,400 |
| 2024 | $3,229 | $218,800 | $85,400 | $133,400 |
| 2023 | $2,985 | $197,000 | $77,600 | $119,400 |
| 2022 | $2,853 | $167,900 | $67,500 | $100,400 |
| 2021 | $2,708 | $153,800 | $61,400 | $92,400 |
| 2020 | $2,579 | $147,700 | $61,400 | $86,300 |
| 2019 | $2,534 | $141,100 | $61,400 | $79,700 |
| 2018 | $2,474 | $135,100 | $58,400 | $76,700 |
| 2017 | $2,510 | $145,000 | $58,400 | $86,600 |
| 2016 | $2,359 | $139,500 | $58,400 | $81,100 |
| 2015 | $2,468 | $140,700 | $58,400 | $82,300 |
| 2014 | $1,234 | $140,700 | $58,400 | $82,300 |
Source: Public Records
Map
Nearby Homes
Your Personal Tour Guide
Ask me questions while you tour the home.