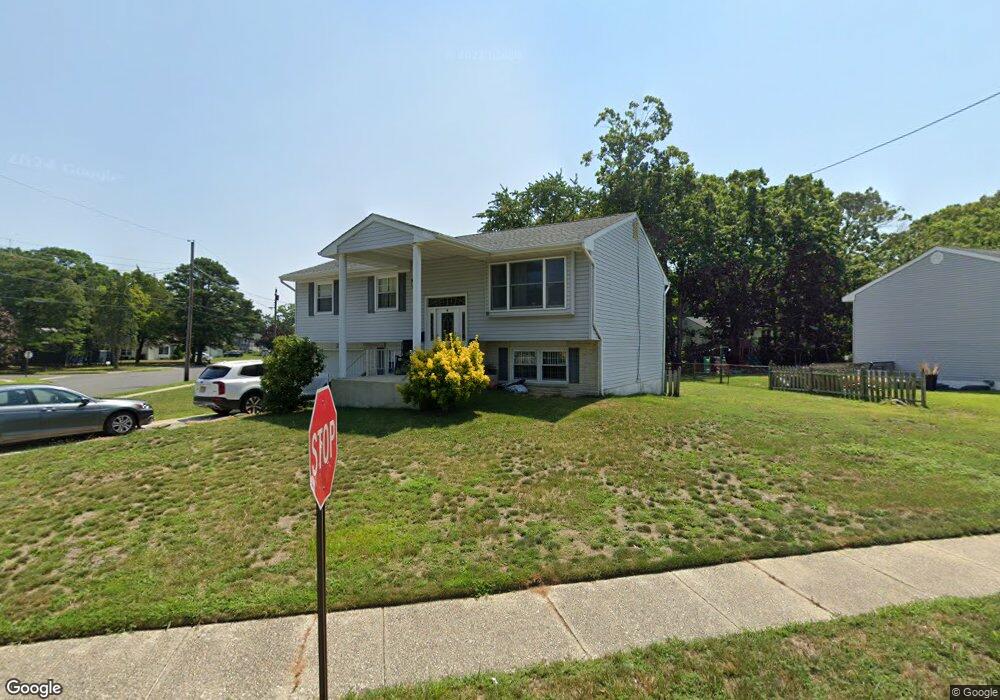
34 Chapman Blvd Somers Point, NJ 08244
Estimated Value: $396,000 - $419,000
3
Beds
2
Baths
1,802
Sq Ft
$227/Sq Ft
Est. Value
About This Home
This home is located at 34 Chapman Blvd, Somers Point, NJ 08244 and is currently estimated at $409,683, approximately $227 per square foot. 34 Chapman Blvd is a home located in Atlantic County with nearby schools including Mainland Regional High School, ChARTer TECH High School for the Performing Arts, and Gospel of Grace Christian School.
Ownership History
Date
Name
Owned For
Owner Type
Purchase Details
Closed on
Feb 28, 2011
Sold by
Royce Phuong and Royce Garry
Bought by
Perry Jamil A
Current Estimated Value
Home Financials for this Owner
Home Financials are based on the most recent Mortgage that was taken out on this home.
Original Mortgage
$180,310
Outstanding Balance
$127,951
Interest Rate
5.5%
Mortgage Type
FHA
Estimated Equity
$281,732
Purchase Details
Closed on
Sep 29, 1999
Sold by
Duffield Harry and Duffield Gale
Bought by
Royce Phuong and Royce Garry S
Home Financials for this Owner
Home Financials are based on the most recent Mortgage that was taken out on this home.
Original Mortgage
$96,950
Interest Rate
7.42%
Create a Home Valuation Report for This Property
The Home Valuation Report is an in-depth analysis detailing your home's value as well as a comparison with similar homes in the area
Home Values in the Area
Average Home Value in this Area
Purchase History
| Date | Buyer | Sale Price | Title Company |
|---|---|---|---|
| Perry Jamil A | $185,000 | Cape Atlantic Title Agency L | |
| Royce Phuong | $138,500 | The Title Company |
Source: Public Records
Mortgage History
| Date | Status | Borrower | Loan Amount |
|---|---|---|---|
| Open | Perry Jamil A | $180,310 | |
| Previous Owner | Royce Phuong | $96,950 |
Source: Public Records
Tax History Compared to Growth
Tax History
| Year | Tax Paid | Tax Assessment Tax Assessment Total Assessment is a certain percentage of the fair market value that is determined by local assessors to be the total taxable value of land and additions on the property. | Land | Improvement |
|---|---|---|---|---|
| 2025 | $7,424 | $207,600 | $69,200 | $138,400 |
| 2024 | $7,424 | $207,600 | $69,200 | $138,400 |
| 2023 | $6,936 | $207,600 | $69,200 | $138,400 |
| 2022 | $6,936 | $207,600 | $69,200 | $138,400 |
| 2021 | $6,832 | $207,600 | $69,200 | $138,400 |
| 2020 | $6,693 | $207,600 | $69,200 | $138,400 |
| 2019 | $6,504 | $207,600 | $69,200 | $138,400 |
| 2018 | $6,367 | $207,600 | $69,200 | $138,400 |
| 2017 | $6,139 | $207,600 | $69,200 | $138,400 |
| 2016 | $5,861 | $207,600 | $69,200 | $138,400 |
| 2015 | $5,800 | $207,600 | $69,200 | $138,400 |
| 2014 | $5,605 | $207,600 | $69,200 | $138,400 |
Source: Public Records
Map
Nearby Homes