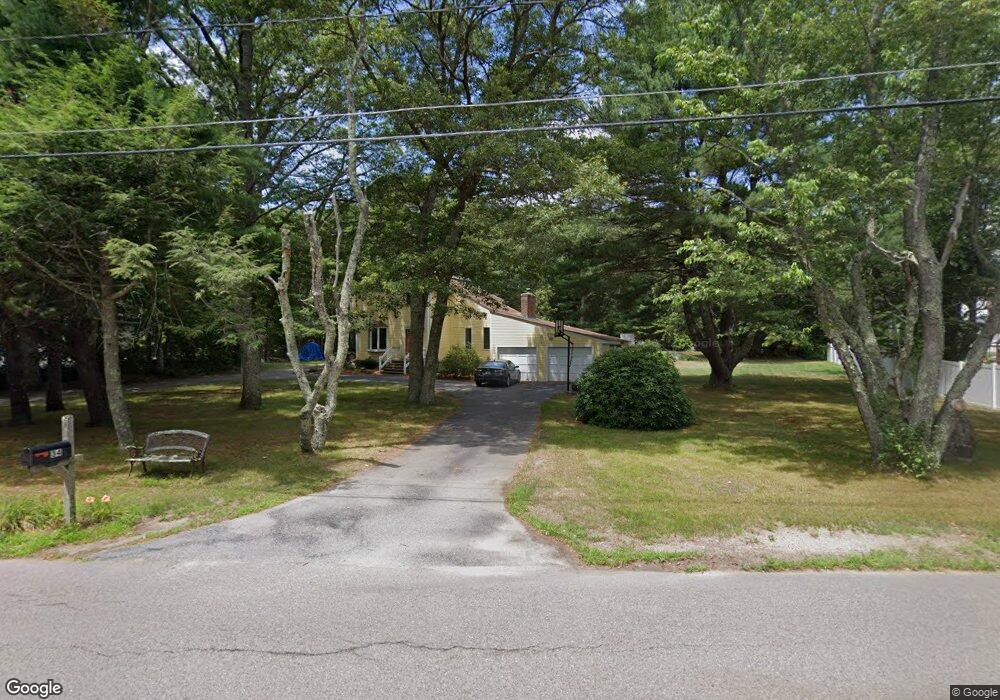
34 Chase Dr Sharon, MA 02067
Estimated Value: $816,000 - $898,000
3
Beds
3
Baths
2,016
Sq Ft
$426/Sq Ft
Est. Value
About This Home
This home is located at 34 Chase Dr, Sharon, MA 02067 and is currently estimated at $859,624, approximately $426 per square foot. 34 Chase Dr is a home located in Norfolk County with nearby schools including Heights Elementary School, Sharon Middle School, and Sharon High School.
Ownership History
Date
Name
Owned For
Owner Type
Purchase Details
Closed on
Oct 30, 2000
Sold by
Holzinger Steven T and Holzinger Donna L
Bought by
Daylor James P
Current Estimated Value
Home Financials for this Owner
Home Financials are based on the most recent Mortgage that was taken out on this home.
Original Mortgage
$236,000
Interest Rate
7.83%
Mortgage Type
Purchase Money Mortgage
Purchase Details
Closed on
Jan 28, 1993
Sold by
Garvin Carl and Garvin Genevieve A
Bought by
Holzinger Steven T and Holzinger Donna L
Home Financials for this Owner
Home Financials are based on the most recent Mortgage that was taken out on this home.
Original Mortgage
$137,600
Interest Rate
8.16%
Mortgage Type
Purchase Money Mortgage
Create a Home Valuation Report for This Property
The Home Valuation Report is an in-depth analysis detailing your home's value as well as a comparison with similar homes in the area
Home Values in the Area
Average Home Value in this Area
Purchase History
| Date | Buyer | Sale Price | Title Company |
|---|---|---|---|
| Daylor James P | $295,000 | -- | |
| Holzinger Steven T | $172,000 | -- |
Source: Public Records
Mortgage History
| Date | Status | Borrower | Loan Amount |
|---|---|---|---|
| Open | Holzinger Steven T | $295,000 | |
| Closed | Holzinger Steven T | $275,000 | |
| Closed | Holzinger Steven T | $236,000 | |
| Previous Owner | Holzinger Steven T | $137,600 |
Source: Public Records
Tax History
| Year | Tax Paid | Tax Assessment Tax Assessment Total Assessment is a certain percentage of the fair market value that is determined by local assessors to be the total taxable value of land and additions on the property. | Land | Improvement |
|---|---|---|---|---|
| 2025 | $12,701 | $726,600 | $393,400 | $333,200 |
| 2024 | $12,102 | $688,400 | $361,000 | $327,400 |
| 2023 | $11,823 | $636,000 | $337,500 | $298,500 |
| 2022 | $11,165 | $565,300 | $281,200 | $284,100 |
| 2021 | $10,871 | $532,100 | $256,600 | $275,500 |
| 2020 | $9,948 | $523,600 | $248,100 | $275,500 |
| 2019 | $9,868 | $508,400 | $229,600 | $278,800 |
| 2018 | $9,427 | $486,700 | $225,200 | $261,500 |
| 2017 | $9,263 | $472,100 | $210,600 | $261,500 |
| 2016 | $9,031 | $449,100 | $210,600 | $238,500 |
| 2015 | $8,534 | $420,400 | $193,100 | $227,300 |
| 2014 | $7,901 | $384,500 | $175,500 | $209,000 |
Source: Public Records
Map
Nearby Homes
- 3 Wampanoag Rd
- 2 Foxfire Dr
- 174 E Foxboro St
- 111 E Foxboro St
- 668 S Main St
- 132 Massapoag Ave
- 1 Maura Elizabeth Ln
- 24 Eastman Ave
- 180 Old Post Rd Unit 202
- 180 Old Post Rd Unit 206
- 180 Old Post Rd Unit 308
- 180 Old Post Rd Unit 201
- 180 Old Post Rd Unit 405
- 180 Old Post Rd Unit 207
- 31 Spring Ln
- 48 Spring Ln
- 22 Ames Ct
- 9 Independence Dr Unit 9
- 3 Willow St
- 1 Roseland St Unit B-14
Your Personal Tour Guide
Ask me questions while you tour the home.